
Figures & data
Figure 1. The location of the iMHEA sites within the major land cover types of the tropical Andes. JTU: Jatunhuaycu; PIU: Piura; HUA: Huaraz.
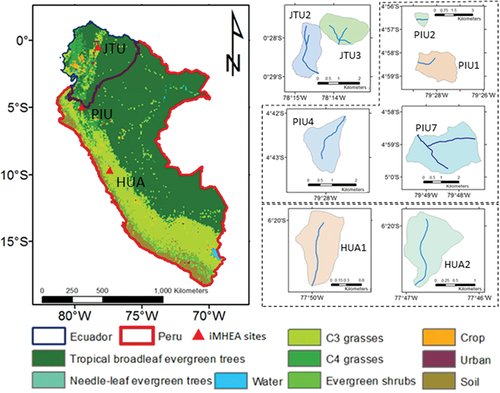
Table 1. Description of the monitored catchments. BET-Tr: tropical broadleaf evergreen trees; C3: C3 grasses; C4: C4 grasses; ESH: evergreen shrubs; BS: bare soil. The codes JTU, PIU, and HUA refer to the locations shown in .
Table 2. Description of soil parameters, as sourced from Best et al. (Citation2011).
Table 3. Soil parameterization using pedotransfer functions. CL: clay fraction; SA: sand fraction; SI: silt fraction; DBD: dry bulk density (g cm−3); SOC: soil organic carbon (% weight); CEC: carbon exchange capacity (cmol kg−1); pH: hydrogen ion activity.
Table 4. Soil parameters used in this study’s JULES set-up.
Figure 2. Water retention curves obtained from PTF estimation (PIU, HUA, JTU) and in situ investigations in the JTU catchment (EXP)2013.
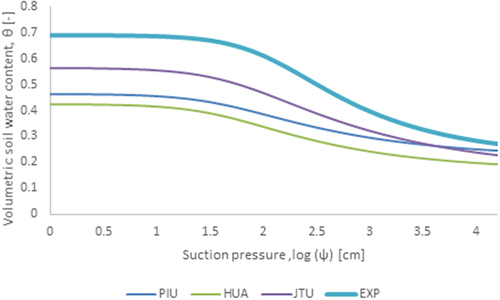
Figure 3. D8 flow routine in the catchment: (a) JTU2; (b) JTU3.
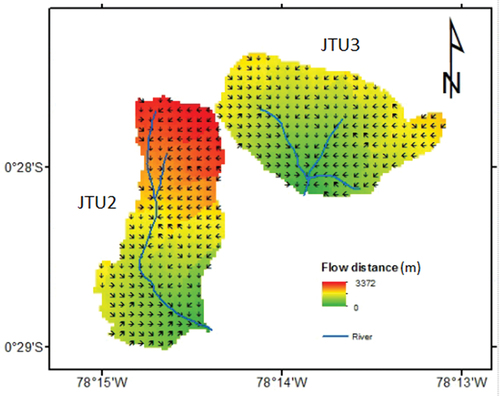
Figure 4. Left: a comparison of the observed and modelled flows of (a) JTU3, (b) JTU2, (c) HUA1, and (d) HUA2. Right: flow duration curves of the same hydrographs.
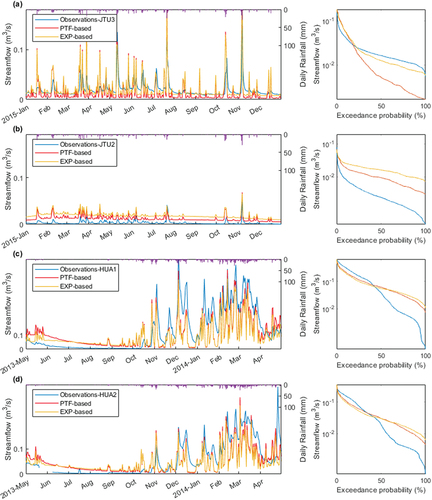
Figure 5. Left: a comparison of the observed and modelled flows of (a) PIU1, (b) PIU2, (c) PIU4, and (d) PIU7. Right: flow duration curves of the same hydrographs.
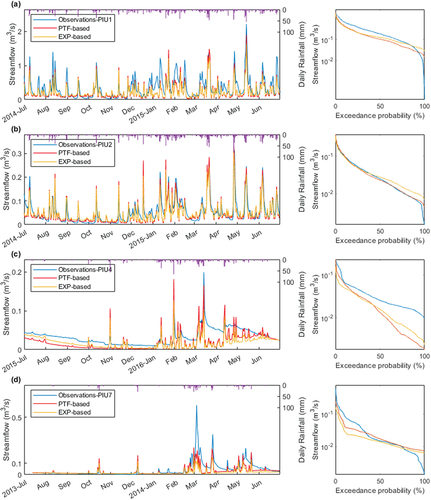
Figure 6. NSE score of the modelling flow in each catchment.
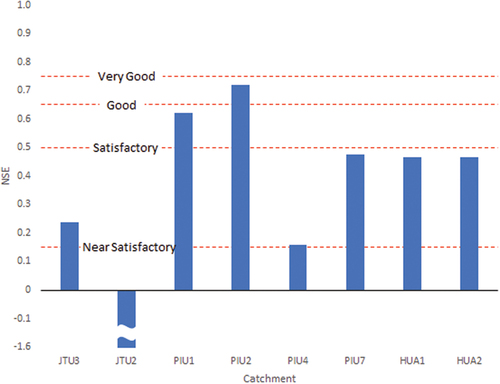
Table 5. Hydrological summary indices as calculated from the observed and modelled flow time series based on a daily time step in this study. OBS: observations; PTF: PTF-based set-up; EXP: EXP-based set-up; RR: rainfall–runoff ratio; BFI: baseflow index; R2FDC: slope of the flow duration curve; NSE: Nash-Sutcliffe efficiency. The codes JTU, PIU, and HUA refer to the locations shown in .