
Figures & data
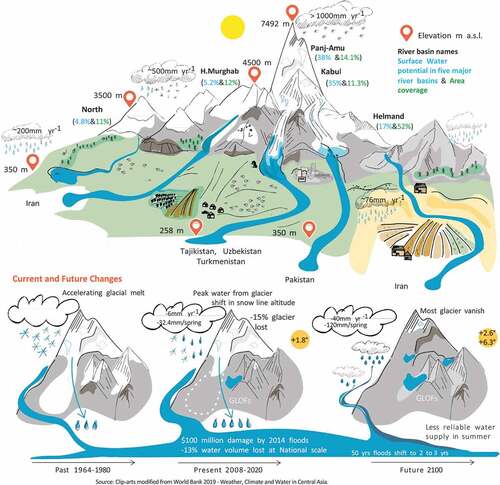
Figure 1. Geographical map of Afghanistan, showing elevation, river lines, hydro-meteorological stations, and glacier coverage, and identifying the four most glacier- covered regions. The subordinating map shows the provincial boundaries of Afghanistan.
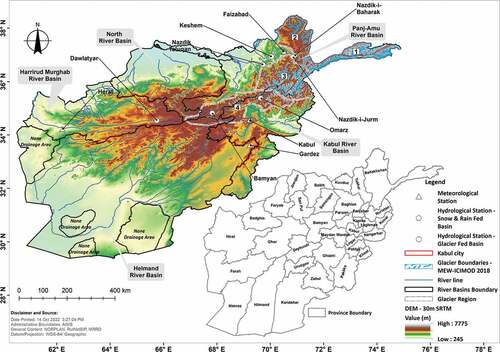
Figure 2. Precipitation map of Afghanistan and the nearest parts of the neighbouring countries (after Breckle and Rafiqpoor Citation2010, Shroder Citation2014).Source: Natural Resources in Afghanistan, Shroder, J.F., Soil and Vegetation In extremis, 116-137., 2014, with permission from Elsvier.
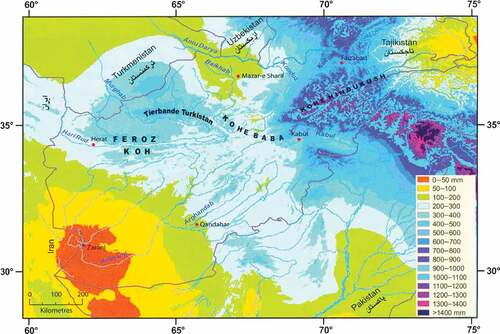
Table 1. Comparisons of climate study findings at the national scale. X indicates “does not apply” or “information not available.”
Figure 3. Changes in (a) mean temperature, (b) minimum mean, (c) maximum mean and (d) precipitation by season between 1964–1977 and 2007–2018. The two periods shown for are those for which data availability is common to all four stations.
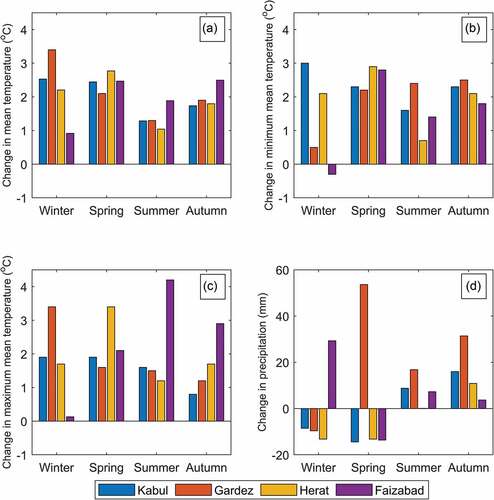
Table 2. Surface water volume in five Afghan river basins between 1969–1980 and 2007–2016 (source: Bromand Citation2017). BCM: billion cubic metres.
Figure 4. Hydrographs from individual gauging stations for six glacierized basins (a–f) and one snow-fed basin (g) for two time periods (1969–1977 and 2008–2016).
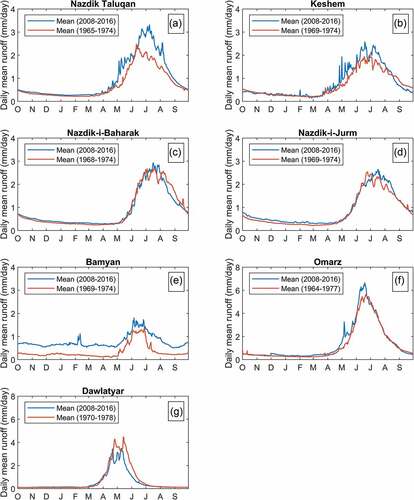
Figure 5. Hydrogeological map of Afghanistan. Compiled by Malyarove and digitized by Hamidi and Saffi in 2017 (Saffi et al. Citation2019).Source: Hydro-geological booklet Sar-i-Pul province. Saffi et al, Danish Committee for Aid to Afghan Refugees. Kabul, Afghanistan. p.44, 2019. with permission from Saffi M.H.
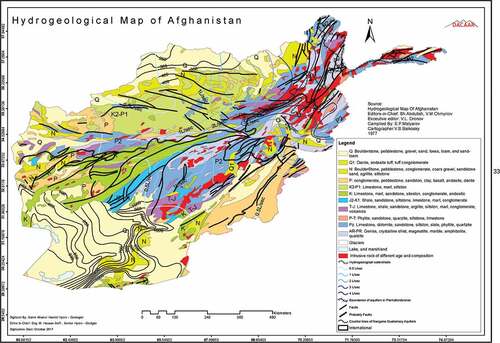
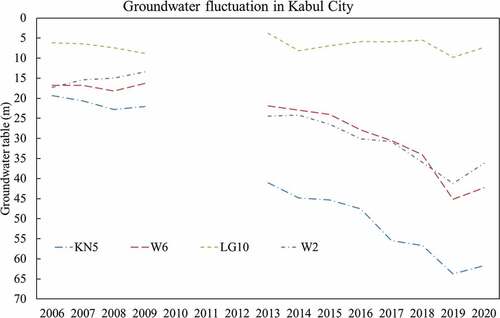
Figure 6. Groundwater fluctuations in Kabul city between 2006 to 2020 at four main locations (KN5 in the east, W6 and W2 in the west, and LG10 in the south part of the city).
Data availability statement
The climate data of four meteorological stations were acquired from the Afghanistan Meteorological Department (AMD) http://www.amd.gov.af/ and discharge data of seven hydrological stations () were obtained from the Ministry of Energy and Water of Afghanistan https://mew.gov.af/en by an official request letter from the University of Lausanne.