Figures & data
Figure 1. Monthly mean precipitation (grey) and number of annual maximum occurrences by month (black dots).
Table 1. Observation statistics.
Figure 2. E-GPD upper tail decay for different ξ values.
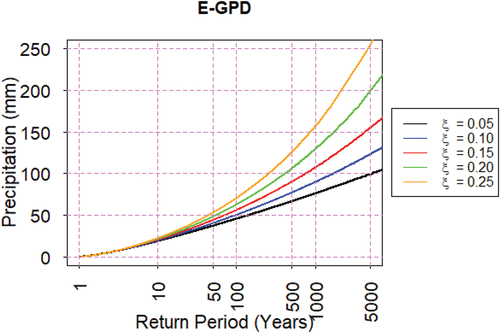
Figure 3. Box plots of the estimated quantiles (standardized with the population quantiles) for the four information scenarios. Both the RRMSE (expressed in %) and the CV are shown on top of each box plot for each T.
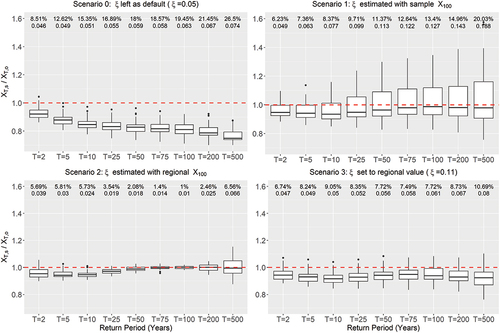
Figure 4. Reduction of RRMSE for the three scenarios compared to scenario 0 (parameter ξ set to 0.05.
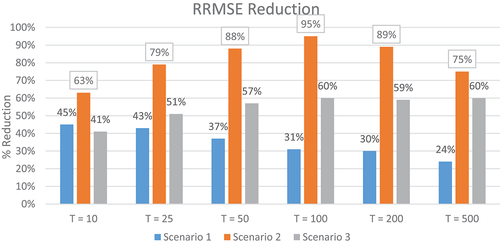
Figure 5. Box plots of the estimated quantiles (standardized with the population quantiles) for different calibration in scenario 2.
Figure 6. Box plots of the ξ values for different calibration values in scenario 2.
Figure 7. Box plots of the Monte Carlo simulation calibrated with the regional for populations with different extremality (i.e. ξ values of 0.09, 0.11, 0.13 and 0.25).
Figure 8. Box plots of the Monte Carlo simulation from 60-, 90- and 120-year samples – scenario 3 (ξ set to 0.11).