Figures & data
Figure 1. Major rivers and gauging stations in the study area: Murray-Hotham catchment of Western Australia.
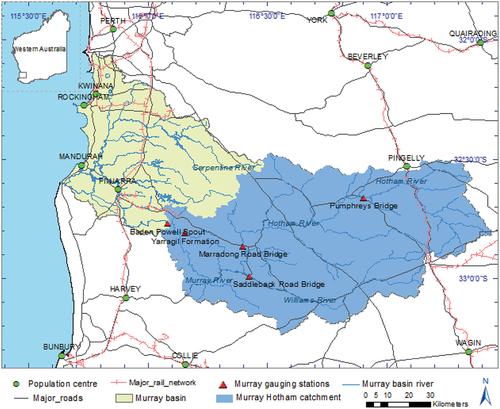
Figure 2. Schematic representation of the bias correction method and corrected flow for GCMs.
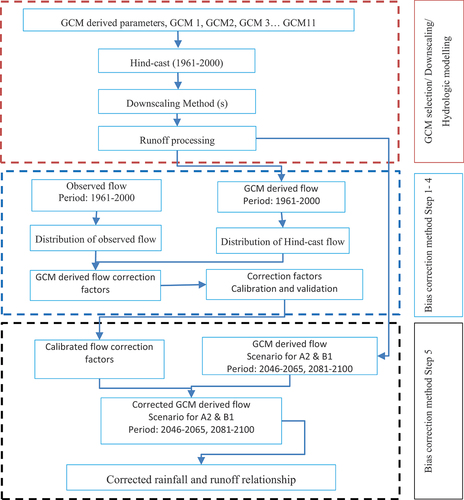
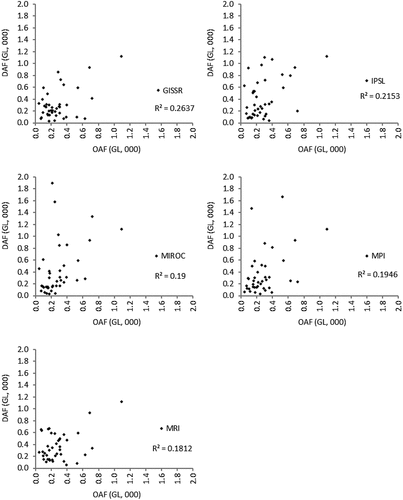
Table 1. Comparative analysis of goodness of fit between GCM DAF and OAF.
Figure 3. The state of bias in GCM-derived annual flow for the hindcast period (1961–2000) at Baden Powell gauging station: (a) time series plot, and (b) cumulative time series plot.
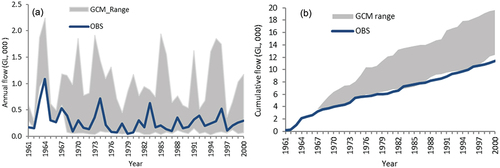
Table 2. Summary of statistics (NSE, CC and E) measuring the calibration and validation performance for all GCMs.
Figure 4. Calibration and validation of the bias correction method for CNRM at Baden Powell gauging station: (a) DAF and OAF for calibration period with ordered DAFo and OAFo; (b) polynomial relationship between CFa and DAF; (c) transformation of CFp in the relationship; (d) corrected DAF for the calibration and validation periods; and (e) performance measure of calibration and validation through flow residuals.
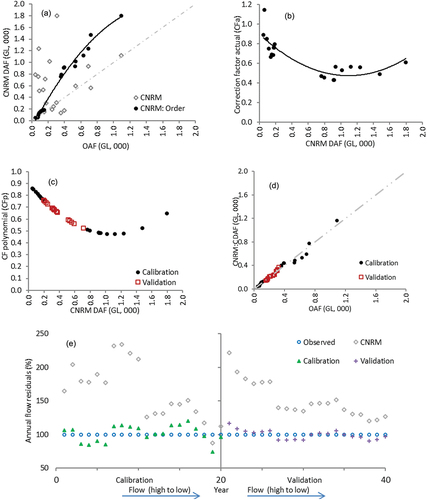
Figure 5. Corrected DAFc for 11 GCMs for the hindcast period (1961–2000) which covers both calibration and validation periods. The ranges of cumulative DAF and DAFc for 11 GCMs are summarized with observed annual flow for the hindcast period where DAFc was achieved through the calibration and validation process.
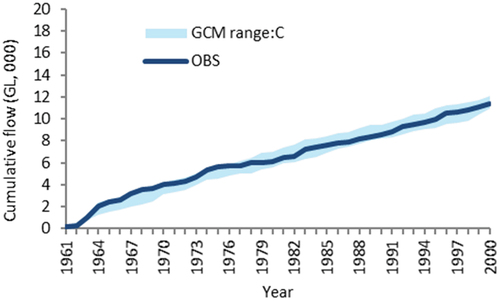
Table 3. Mean and standard deviation (STD) of DAF and corrected DAF (GL) for 11 GCMs for scenarios A2 and B1 during the mid (2046–2065) and late century (2081–2100) at Baden Powell gauging station.
Figure 6. Cumulative distribution of DAF before and after correction as represented by 11 GCMs during the mid and late century under scenarios A2 and B1. The corresponding ensemble means of DAF for 11 GCMs are also presented before and after correction. The GCM range represents the maximum and minimum GCM DAF in the ensemble of 11 GCMs for the projected period, while the GCM range:C means the same after bias correction. Cum:Avg. represents the cumulative ensemble mean of 11 GCMs’ DAF for the projected period, while Cum:Avg:C means the same after bias correction.
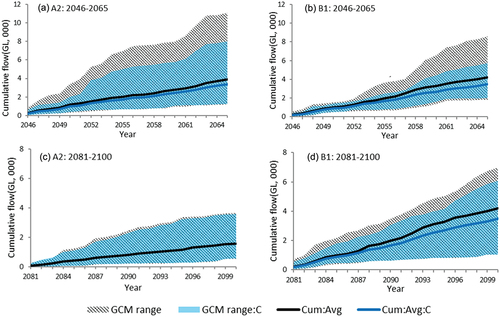
Table 4. Comparison of reduction of runoff and corrected reduction of runoff for the ensemble mean of 11 GCMs for scenarios A2 and B1 for mid- and late century. Values in parentheses (taken from Islam et al. Citation2014) represent runoff reduction before the correction method is applied.
Figure A1. The GCM-derived annual flow values for 11 GCMs are plotted against the corresponding observed annual flow for the hindcast period at Baden Powell gauging station.
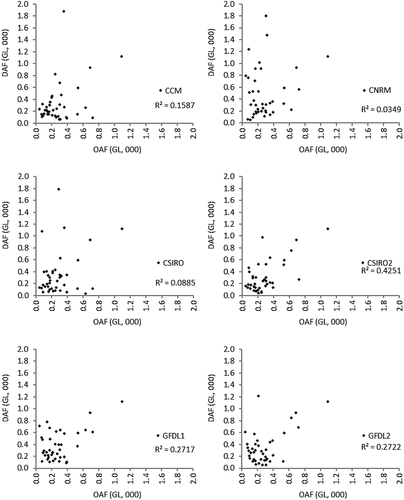
Figure A1. (Continued).