822
Views
0
CrossRef citations to date
0
Altmetric
Physiology and Nutrition

Mechanically demanding eccentric exercise increases nuclear factor erythroid 2-related factor 2 activity in human peripheral blood mononuclear cells

ORCID Icon, , ORCID Icon, ORCID Icon, ORCID Icon & ORCID Icon
Pages 1231-1239 | Received 05 Aug 2023, Accepted 20 Sep 2023, Published online: 27 Sep 2023

Figures & data

Table 1. Group comparison of participants’ physical characteristics and 2 d average energy intake.

Table 2. Group comparison of jump characteristics during exercise.

Figure 1. Fold change (vs pre-intervention) of nuclear factor erythroid 2-related factor 2 (NRF2) binding to antioxidant response element (ARE) oligonucleotides at post- and 1 h post-intervention. Symbols represent individual values. Whiskers correspond to lowest and highest values. Horizontal line within-box define median values. Exercise group (circles, n = 15); non-exercise group (triangles, n = 9). * = significantly different between groups. # = significantly lower than resting values. ## = significantly higher than post-exercise values. Statistical significance set at p < 0.05.
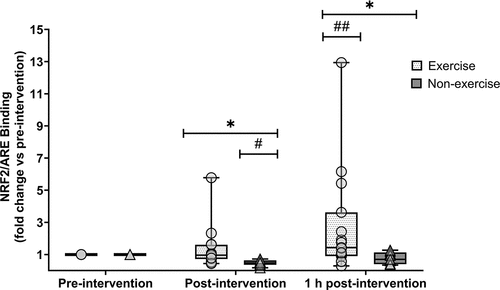
Figure 1. Fold change (vs pre-intervention) of nuclear factor erythroid 2-related factor 2 (NRF2) binding to antioxidant response element (ARE) oligonucleotides at post- and 1 h post-intervention. Symbols represent individual values. Whiskers correspond to lowest and highest values. Horizontal line within-box define median values. Exercise group (circles, n = 15); non-exercise group (triangles, n = 9). * = significantly different between groups. # = significantly lower than resting values. ## = significantly higher than post-exercise values. Statistical significance set at p < 0.05.

Figure 2. Enzymatic activity of NRF2 target genes (a) glutathione reductase (GR) and (b) glutathione peroxidase (GPX) at pre-, post- and 1 h post-intervention. Symbols represent individual values. Whiskers correspond to lowest and highest values. Horizontal line within-box define median values. Exercise group (circles, n = 16); non-exercise group (triangles, n = 9). * = significantly different between groups. Statistical significance set at p < 0.05.
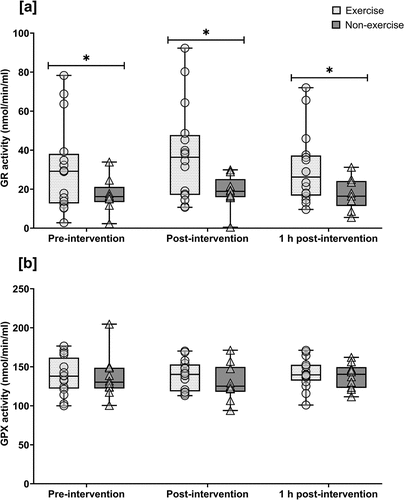
Figure 2. Enzymatic activity of NRF2 target genes (a) glutathione reductase (GR) and (b) glutathione peroxidase (GPX) at pre-, post- and 1 h post-intervention. Symbols represent individual values. Whiskers correspond to lowest and highest values. Horizontal line within-box define median values. Exercise group (circles, n = 16); non-exercise group (triangles, n = 9). * = significantly different between groups. Statistical significance set at p < 0.05.

Data availability statement

Data can be provided at a reasonable request from the corresponding author.