
Figures & data
Figure 1. Annual publications and citation trend in SIJ during 1981–2020. This figure represents the annual publications and citations of SIJ.
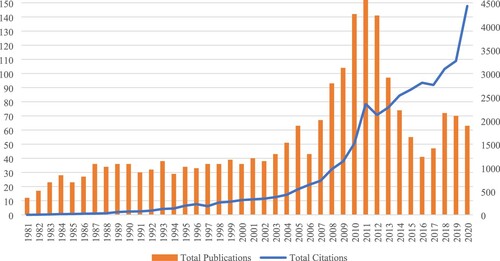
Figure 2. Publications in each major cluster. This figure represents the period-wise publications in each of the major cluster.
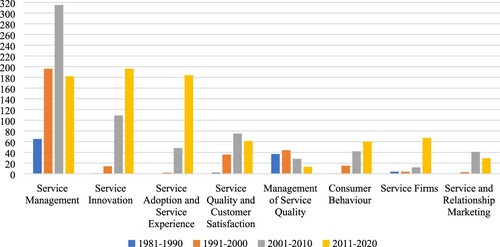
Table 1. Summary of Cluster 1 and proposed future directions.
Figure 3. Share of different research designs in SIJ research during 1981–2020. This figure presents the share of different research designs in SIJ research between 1981 and 2020. Others include the research designs not classified under other four categories, like using more than one research design, among others.
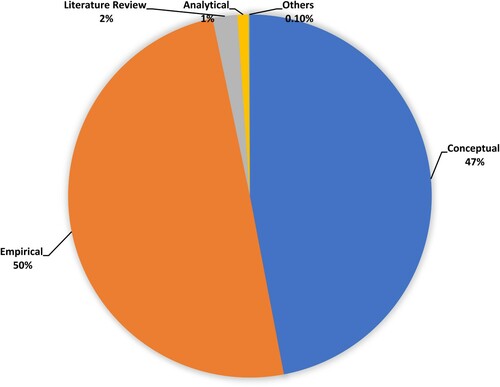
Figure 4. Share of different research methods in SIJ research during 1981–2020. This figure represents the share of different research methods in SIJ research between 1981 and 2020. Here not mentioned category includes the articles which did not mention their method of analysis (primarily conceptual articles). The share presented is below names of each category.
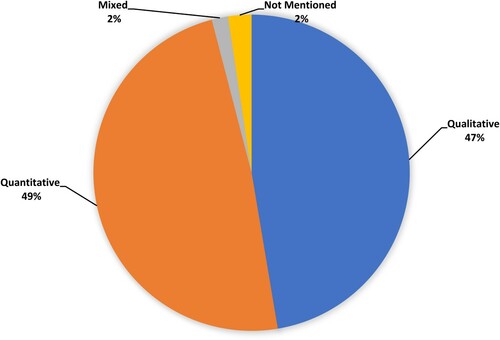
Figure 5. Share of different data collection methods in SIJ research during 1981–2020. This figure represents the share of different data collection methods in SIJ research between 1981 and 2020. Here no data reported/collected includes articles that did not mention their data sources. The qualitative category includes interviews, observations, and focus groups. The multi-method category includes studies that used combination of one or more data collection techniques. The share presented is below names of each category.
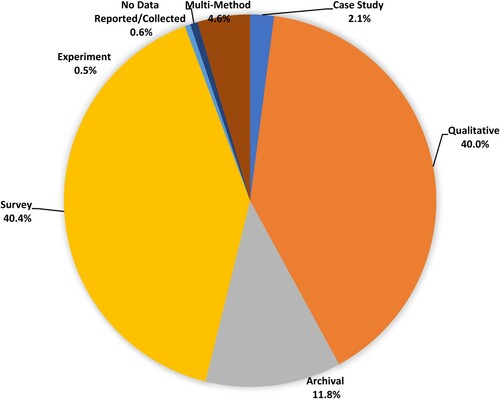
Figure 6. The sectoral focus of SIJ research during 1981–2020. This figure represents the share of different sectors in research published in SIJ between 1981 and 2020. Others represent all the sectors with less than 1% share in the research. Some examples include manufacturing, fashion etc. The unmentioned category represents the articles that did not mention their industry focus. The share presented is below names of each category.
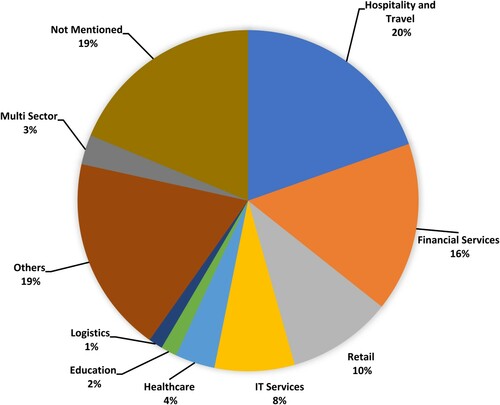
Figure 7. The keyword co-occurrence network of the last five years (2016–2020). The network presents a keyword network in the last five years. Here the size of bubbles represents the connectivity of a keyword with other keywords, and the thickness of links represent the co-occurrence of keywords.
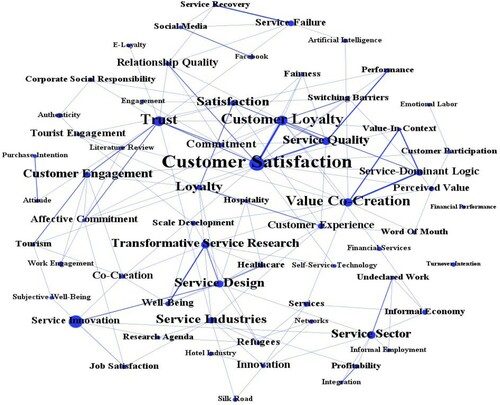
Table 2. List of special issues published in SIJ during the 2018–2021 period.