Figures & data
Table 1. Psycholinguistic properties (mean and SD) of the stimuli in the three subsets contrasting lexical frequency, length and onset phoneme properties and latencies (in ms) for the analysed dataset.
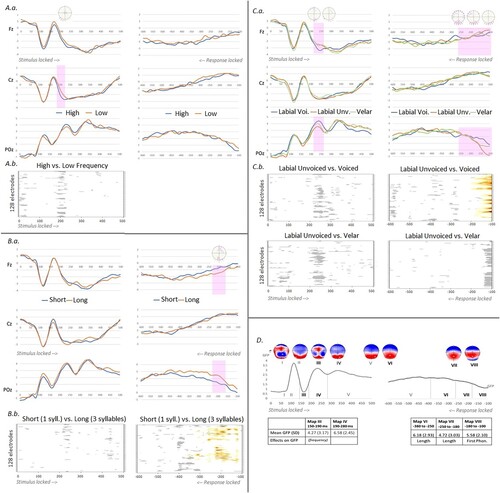
Figure 1. Results of the ERP analyses on each of the three data sub-sets. A. High versus low lexical frequency. a. Exemplar waveforms on Fz, Cz and POz for each condition in stimulus-locked ERPs in the left hand-side and response-locked on the right. The pink bar represents the time-period of significant difference between conditions in the (uncorrected) t-test analysis run on each electrode and time-point; on top, all the electrodes yielding the difference within this time-window are highlighted in pink. b. Results of the ERP cluster mass waveform analyses on the stimulus-locked ERPs on electrodes (Y axes) and time points (X axes) for high and low lexical frequency. The analysis did not display any period of significant p values (in white and gray, p ≥ 0.05). B. Monosyllabic (short) versus three-syllabic (long) words. a. Exemplar waveforms on Fz, Cz and POz for each condition in stimulus-locked ERPs in the left hand-side and response-locked on the right. The pink bar represents the time-period of significant difference between conditions in the (uncorrected) t-test analysis run on each electrode and time-point; on top, all the electrodes yielding the difference within this time-window are highlighted in pink. b. Results of the ERP cluster mass waveform analyses on electrodes (Y axes) and time points (X axes) on the stimulus-locked and response-locked ERPs (in red p < 0.01 and in yellow p < 0.05, in white and gray, p ≥ 0.05). C. First phoneme properties: unvoiced labial, voiced labial and velar. a. Exemplar waveforms on Fz, Cz and POz for each condition in stimulus-locked ERPs in the left hand-side and response-locked on the right. The pink bar represents the time-periods of significant difference between conditions in the (uncorrected) t-test analysis run on each electrode and time-point; on top, all the electrodes yielding the difference within this time-window are highlighted in pink (the different distributions represent different time-windows and contrasts). b. Results of the ERP cluster mass waveform analyses on electrodes (Y axes) and time points (X axes) on the stimulus-locked and response-locked ERPs for each contrast of interest (in red p < 0.01 and in yellow p < 0.05, in white and gray, p ≥ 0.05). D. Results of the ERP microstate (spatio-temporal segmentation) on stimulus-locked ERPs in the left hand-side and response-locked ERPs on the right with time-periods corresponding to each map summarized under the mean GFP of the averaged data across all epochs. The corresponding map templates (I to VIII) are displayed on top. The table presents the mean GFP (and SD) for the maps observed in the time-windows yielding significant differences across conditions in the results on waveform amplitudes (.A, B and C) and summarizes the effects on GFP of the three (psycho-)linguistic factors in the single trial analyses. * In italics: results of the analyses run with all 120 items and all continuous psycholinguistic factors (see Footnote 2).