Figures & data
Figure 1. Schematics of the experimental sequences followed for the in vitro manipulation of a cell line culture with versatile magnetic particle hyperthermia protocols. Indexes denote in vitro assays performed at each stage: 1: Detached with trypsin, 2: Cytotoxicity with Trypan Blue, 3: Caspase 3/7 activity.
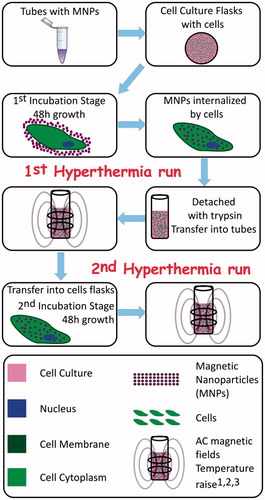
Figure 2. Optical microscopy imaging 17 × of control SaOS-2 sample (a). Prussian Blue stained SaOS-2 after 48 h incubation with MnFe2O4/Fe3O4 (Mn + Fe) (b) and Prussian Blue stained SaOS-2 after 48 h incubation with CoFe2O4/Fe3O4 (Co + Fe) (c) The cells’ colour became blue or partially blue (b and c), indicating the MNPs internalisation by the cancer cells.
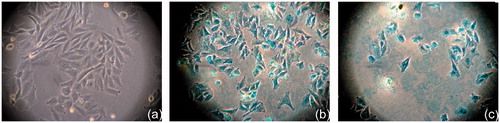
Figure 3. In vitro single-pulse hyperthermia on SaOS-2. Sequences performed in two runs with a 48 h interval in-between: Graph 3a corresponds to first hyperthermia run while Graph 3b corresponds to second hyperthermia run. Blue/red curves refer to cell samples incubated with MnFe2O4/Fe3O4 (Mn + Fe) and CoFe2O4/Fe3O4 (Co + Fe) MNPs respectively while green curve corresponds to heating response of control sample (cells without particles). Samples (cells with particles under field) in both cases safely enter the hyperthermia region (41–45 °C) for ambient time.
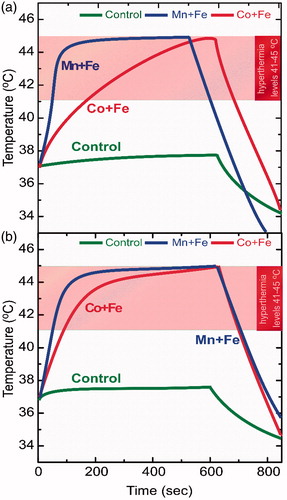
Figure 4. (a) Viability results of single-pulse hyperthermia for SaOS-2 osteoblasts incubated with MnFe2O4/Fe3O4 (Mn + Fe) and CoFe2O4/Fe3O4 (Co + Fe) for two hyperthermia cycles with respect to control sample (cells + MNPs without magnetic field exposure). (b) and (c): Caspase 3/7 activity for human osteosarcoma cell line SaOS-2 for 1st and 2nd hyperthermia run respectively: SaOS-2 osteoblasts incubated with MNPs together with the (reference) control sample of SaOS-2 osteoblasts incubated without MNPs, where “H” denotes the hyperthermia treated samples (only magnetic field exposure in case of control sample).
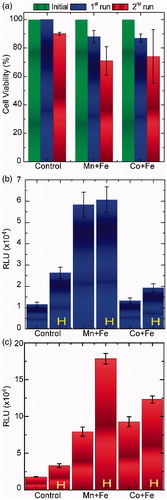
Figure 5. In vitro multiple-pulse hyperthermia protocol on SaOS-2 (top), C2-C12 (middle), 3T3-L1 (bottom). Multiple-pulses hyperthermia sequences performed in two runs with a 48 h interval in-between: Left column graphs (5a, 5b, 5c) correspond to 1st hyperthermia run while right column (5d, 5e, 5f) correspond to 2nd hyperthermia run. Blue and red curves refer to cell samples incubated with MnFe2O4/Fe3O4 (Mn + Fe) and CoFe2O4/Fe3O4 (Co + Fe) MNPs, respectively.
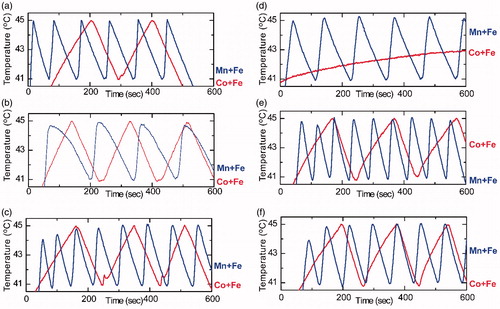
Table 1. Equivalent thermal dose (CEM43) for each individual hyperthermia section of single and multiple pulses together with total number of pulses and the Initial Heating Rate (IHR) at 41 °C.
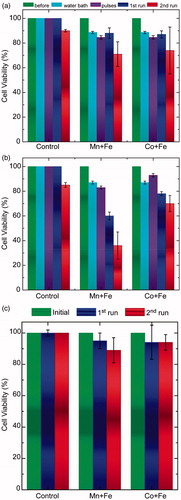
Figure 6. Cell viability comparison of two-run (a) single and (b) multiple-pulse hyperthermia sequences on SaOS-2 osteoblasts in comparison with an equivalent thermal dose (CEM43) warm bath (single: one dip or pulses: dipping in and out). (c) Comparative viability results of multiple-pulses hyperthermia for reference cell line 3T3-L1 incubated with MnFe2O4/Fe3O4 (Mn + Fe) and CoFe2O4/Fe3O4 (Co + Fe) for two hyperthermia runs with respect to control sample (cells + MNPs without treatment).