
Figures & data
Table 1. Measurement of hydrodynamic size and zeta potential of nanoparticles.
Figure 1. Transmission electron micrographs of (A): 5-FU-loaded PLGA nanoparticles with iron oxide cores with magnification ×167 000, (B): PLGA nanoparticles without iron oxide core with magnification ×60 000, (C) SAED image associated with the sample from figure (A).
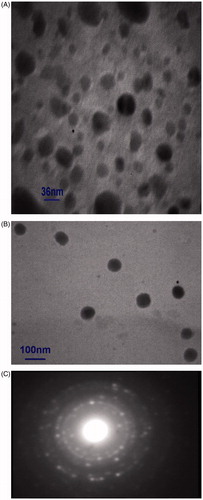
Table 2. Iron content of the cells after 74 h incubation with free and different concentrations of 5-FU-loaded PLGA-coated iron oxide nanoparticles. N(0) mean free nanoparticles and N(1), N(5), N(10) mean the nanoparticles release 1, 5 and 10 μM 5-FU respectively during 74 h, Mean ± STD of three independent experiments. The particle number per cell has been quantitatively calculated.
Figure 2. In vitro release profiles of 5-FU from PLGA nanoparticles with and without iron oxide core. The plot represents the mean ± standard deviation of the results, performed in triplicates.
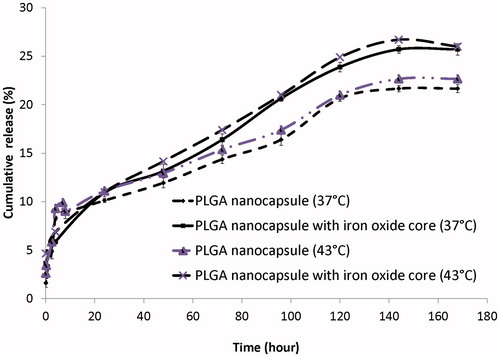
Figure 3. Survival fraction of HT-29 cells in spheroid culture versus different concentrations of 5-FU in the presence and absence of hyperthermia at 43 °C for 1 h. Mean ± SEM of three independent experiments (n = 9).
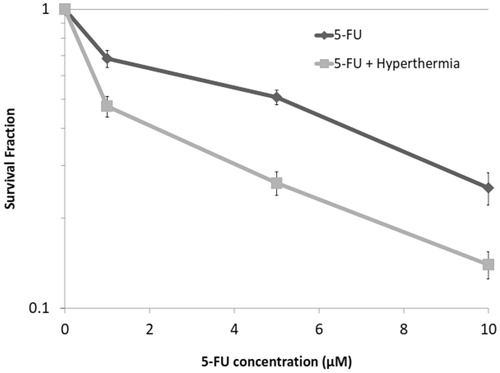
Figure 4. Effects of different concentrations of 5-FU released from (A) PLGA nanoparticles with iron oxide core, (B) PLGA nanoparticles without iron oxide core, alone and in combination with hyperthermia at 43 °C for 1 h, on the survival fraction of HT-29 cells in spheroid culture. Mean ± SEM of three independent experiments (n = 9).
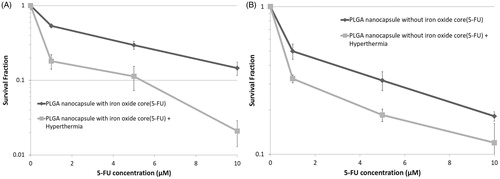
Figure 5. Survival fraction of HT-29 cells in spheroid culture versus different concentrations of free 5-FU or 5-FU-loaded PLGA nanoparticles with and without iron oxide core. Mean ± SEM of three independent experiments (n = 9).
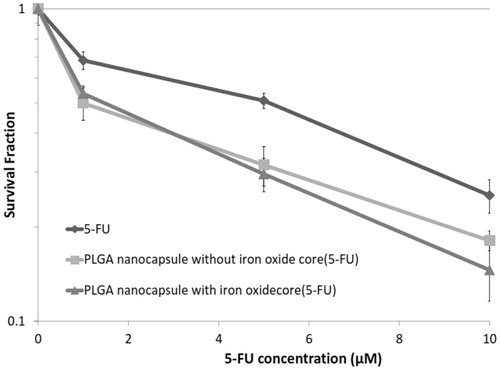
Figure 6. survival fraction of HT-29 cells in spheroid culture versus different concentrations of 5-FU-loaded PLGA nanoparticles with and without iron oxide core in the presence of hyperthermia at 43 °C for 1 h. Mean ± SEM of three independent experiments (n = 9).

Table 3. The extent of cytotoxic effects as compared to the control observed in HT-29 cells on treatment with all forms of 5-FU, both types of nanoparticles alone or in combination with hyperthermia. Mean ± SD of 3 independent experiments (n = 9).