
Figures & data
Figure 1. (a) and (b) show the robot designed by our team including the ultrasound unit (△), the electromagnetic sensor (○), the robotic arm (↓), microwave ablation unit (□), the controller (◇) and screens. c, d show the rigid body and phantom body model with a respiratory simulation device.
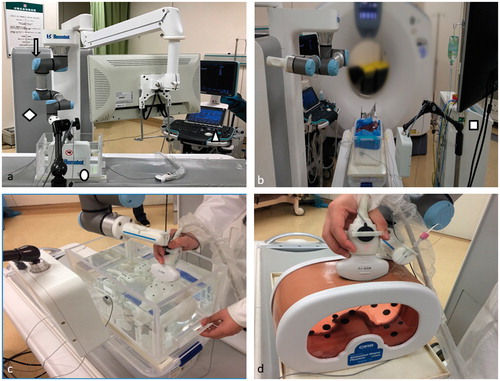
Figure 2. (a) and (b) showed the real-time multimodality imaging of the rabbit liver cancer model and the respiratory calibration curve (△). (c) and (d) showed the real-time multimodality imaging of the porcine liver tumor model.
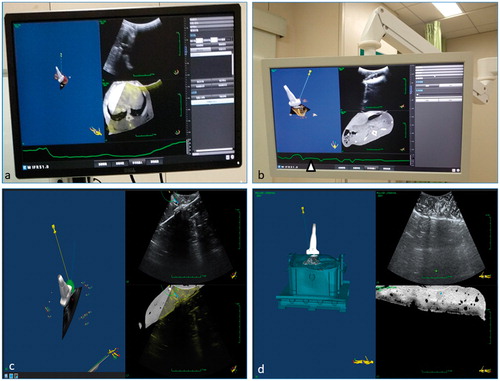
Figure 3. The microwave ablation tests on porcine liver tumor models and rabbit liver cancer models (a,b). (c), (d) and (e) showed the tumors created in the liver and the one in the rabbit.
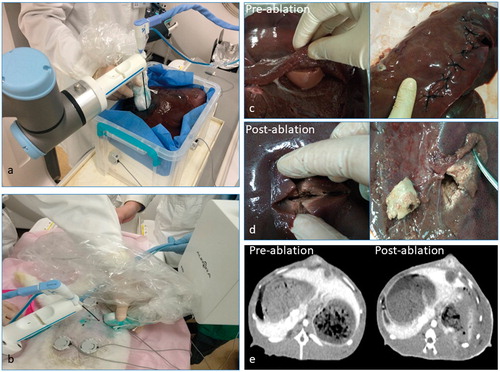
Table 1. Data and statistical results of the accuracy tests of rigid body model and phantom model.
Table 2. Data and statistical results of the microwave ablation tests of porcine liver and rabbit.