Figures & data
Figure 1. (a) The bipolar RF probe and the four thermocouples fixed together by the supporting structure; (b) the cryoprobe with a cylinder shaped tip of 10 mm in diameter; (c) schematic of the RF probe and the four thermocouples inserted inside the liver tissue; (d) illustration of the freezing process by the cryoprobe. The cryoprobe directly touched the liver, and liquid nitrogen was transported to the tip of the probe via the control system; (e) illustration of the electrical conductivity measurement experiments. The electrodes 1, 2,3, 4 contacted the surface of the measuring tissue. An alternated electrical current with different frequency was input to the electrode 1 and back through the electrode 4. The voltage difference between the electrode 2 and 3 was recorded.
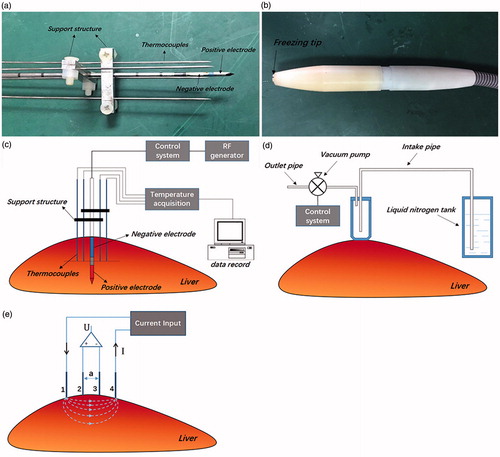
Figure 2. Illustration of the computational domain. The large cylinder was the edge of the surrounding tissue, while the small cylinder was the region that had been frozen.
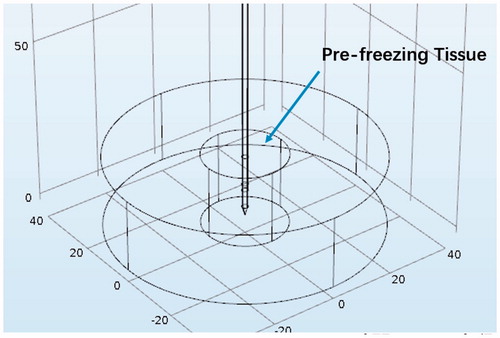
Table 1. The electrical and thermophysical properties used in numerical model.
Table 2. The electrical conductivity measured for the in vivo liver tissue after different treatments at three selected frequencies.
Figure 3. (a,b) Temperature developments at different points in the tissue by RF heating with (red marks) or without (black marks) pre-freezing; (c,d) the magnitude of temperature rising at each measurement point after 2 min; (a,c) ex vivo experiments. The voltage applied was 30 V; (b,d) in vivo experiments. The voltage applied was 28.5 V. Data shown as means with standard deviations (n = 3, *p < .05, **p < 01).
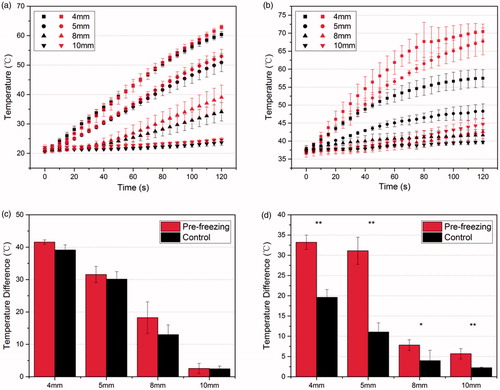
Figure 4. H&E stain images of in vivo tissue. (a) Overall view of the ablated tissue treated by RF heating only. Three distinct zones are identified; (b–d) the enlarged view of zone H1/H2/H3 from (a); (e) overall view of the ablated area treated by RF heating with pre-freezing with the zones specified; (f–h) the enlarged view of zone H1/H2/H3 from (e). The center of the ablation area is the necrosis coagulation zone (H1). The middle zone (H2) is the transition zone, with interstitial infiltration of red blood cells. The outermost zone (H3) is the normal tissue.
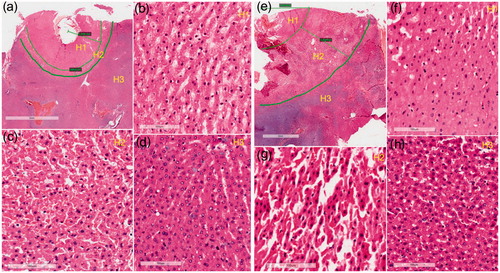
Figure 5. (a) Comparison of the complex impedance of the in vivo rabbit liver at different frequencies (from the right-most to the far-left: 1, 5, 10, 25, 50, 100, 200, 300, 400, 460, 700, 1000, 1500 kHz) in different groups; (b) the modulus of the impedance at different frequencies for tissue in different groups. Data shown as means with standard deviations (n = 3).
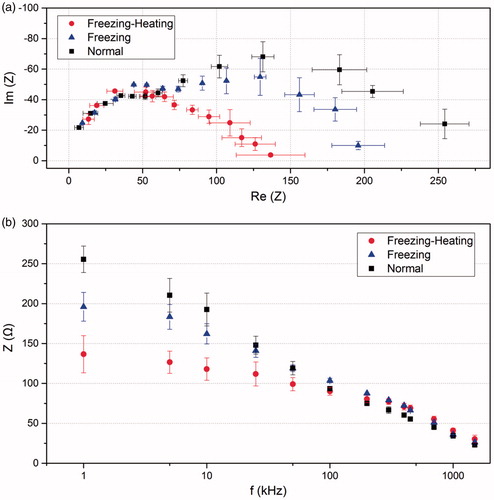
Figure 6. (a) Electrical conductivity of in vivo rabbit liver changing with frequency; (b) electrical conductivity at three selected frequency. Data shown as means with standard deviations (n = 3, *p < .05, **p < .01).
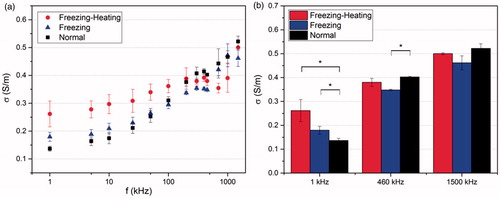
Figure 7. The transient temperature at different points obtained by simulations (lines) and experiments (marks) in the living tissue. (a) RF heating without pre-freezing. The perfusion rate of normal tissue is simulated to be 0.053 (l/s); (b) RF heating with pre-freezing. The thermal conductivity of pre-frozen tissue is simulated to be 0.47 (W/m?K).
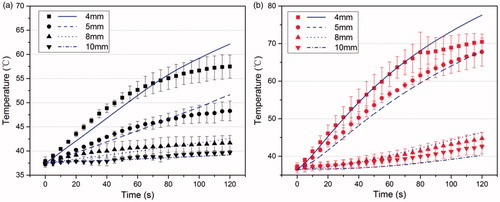
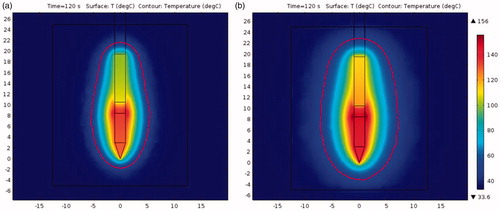
Figure 8. Simulated temperature distribution inside the tissue after being heated for 2 min at the power of 5 W. The red line represents the isotherm of 50 °C. (a) RF heating without pre-freezing; (b) RF heating with pre-freezing.