
Figures & data
Table 1: Baseline and perioperative characteristics of study population.
Figure 1: Kaplan–Meier curves showing the recurrence free survival of patients who received dexmedetomidine (Yes) and those who did not (No).
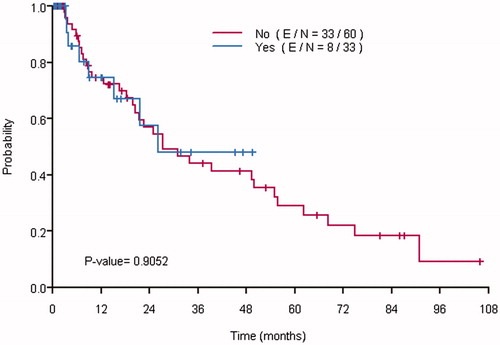
Table 2: Univariate and multivariable cox proportional hazard models for progression free survival.
Figure 2: Kaplan–Meier curves showing the overall survival of patients who received dexmedetomidine (Yes) and those who did not (No).
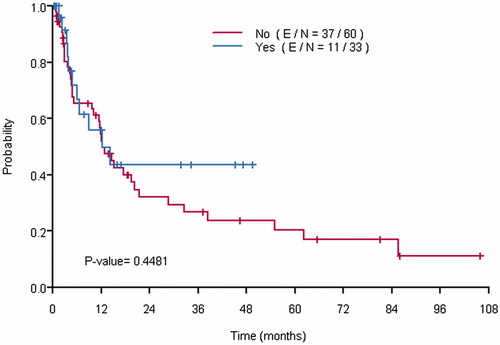
Table 3: Univariate and multivariable cox proportional hazard models for overall survival.