Figures & data
Figure 1. Effect of cold exposure on core body temperature before and after green tea/spice treatment following NOT. *indicates significant difference between before and after treatment; #indicates significant difference between control and treated groups. p < .05.
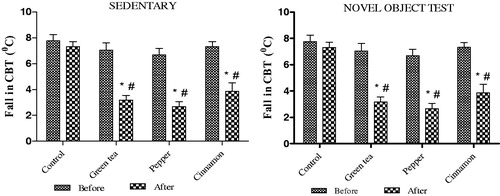
Figure 2. Effect of cold exposure and green tea/spice treatment on the levels of reduced glutathione in BAT, brain, muscle and liver of rats subjected to NOT. *indicates significantly different from control. p < .05.
Table 1. Effect of cold exposure and spice/green tea treatment on changes in norepinephrine and free fatty acid levels in rats subjected to NOT.
Figure 3. Effect of cold exposure and green tea/spice treatment on the MDA levels in BAT, brain, muscle and liver of rats subjected to NOT. *indicates significantly different from control. p < .05.
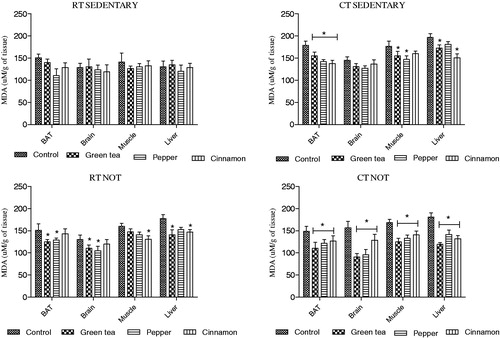
Table 2. Effect of cold exposure and green tea/spice treatment on the levels of reduced glutathione in BAT, brain, muscle and liver of rats subjected to NOT.
Figure 4. Effect of cold exposure and green tea/spice treatment on the SOD activity in BAT, brain, muscle and liver of rats subjected to NOT. *indicates significantly different from control. p < .05.
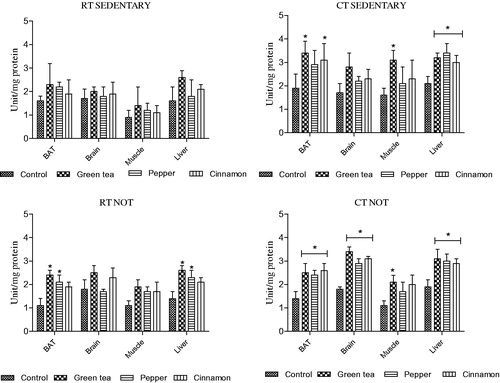
Figure 5. Effect of cold exposure and green tea/spice treatment on the CAT activity in BAT, brain, muscle and liver of rats subjected to NOT. *indicates significantly different from control. p < .05.
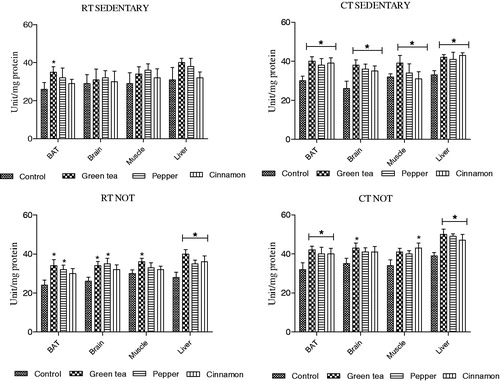
Figure 6. Effect of cold exposure and green tea/spice treatment on the expression of UCP1 levels in BAT of rats subjected to NOT. *indicates significantly different from control. p < .05.
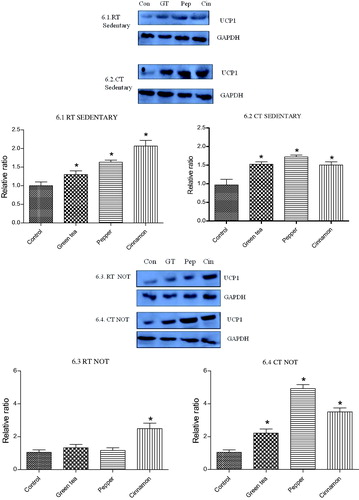
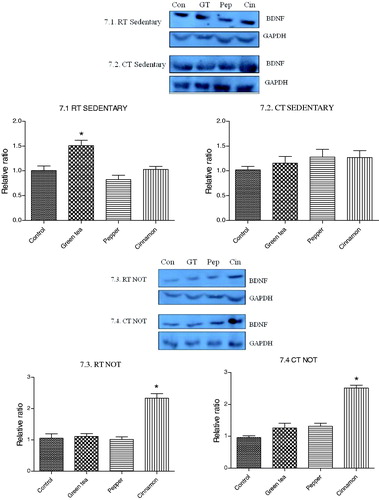
Figure 7. Effect of cold exposure and green tea/spice treatment on the expression of BDNF levels in brain of rats subjected to NOT. *indicates significantly different from control. p < .05.