Figures & data
Table 1. Limitations of previous laser ablation models.
Figure 1. Schematic diagram showing the set-up for simulating GreenlightTM laser tissue ablation process.
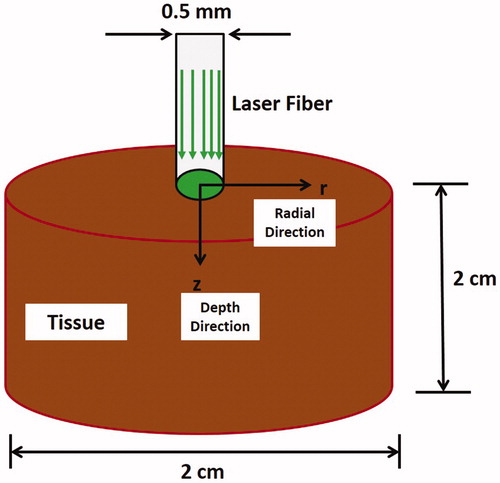
Figure 2. The axisymmetric computational control volume that is used in the model and showing heat fluxes and heat generation.
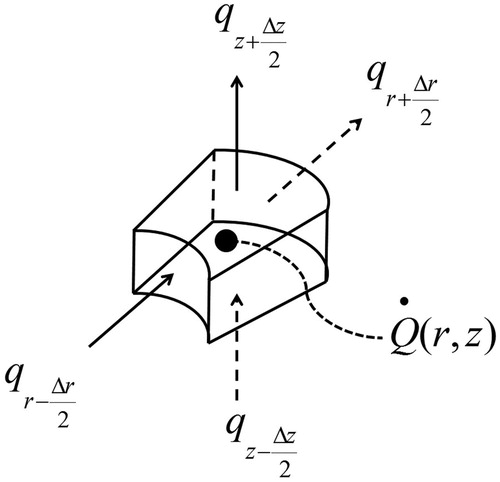
Table 2. Values of the parameters that were used in the computational model [Citation25–28].
Table 3. The values of laser parameters employed in the computational model.
Figure 3. Validation of the computational model against analytical and experimental results. (A) temperature profile of analytical and computational models, (B) tissue front position of analytical and computational models, and (C) Ablation area obtained experimentally and from the computational model [Citation9].
![Figure 3. Validation of the computational model against analytical and experimental results. (A) temperature profile of analytical and computational models, (B) tissue front position of analytical and computational models, and (C) Ablation area obtained experimentally and from the computational model [Citation9].](/cms/asset/19e1aa74-8896-47e1-8590-2d6131e903cd/ihyt_a_1512162_f0003_b.jpg)
Figure 4. Light energy density (J cm − 2) distribution in a tissue after irradiating by laser pulse of 1 J cm − 2 fluence and 0.5 mm spot radius. (A) Distribution prior to ablation crater had formed. (B) Distribution after ablation crater had formed.
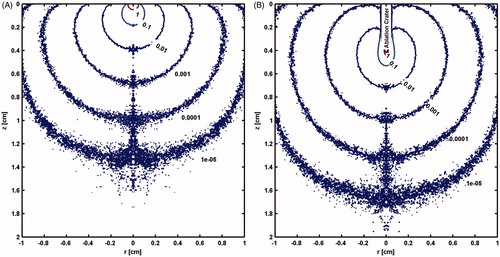
Figure 5. Longitudinal sections showing model predicted evolving temperature profile and ablation crater resulting from irradiation by a 50 W CW laser at times of: (A) 25 ms, (B) 250 ms, (C) 0.5 s, (D) 1 s, (E) 2 s, (F) 3 s.
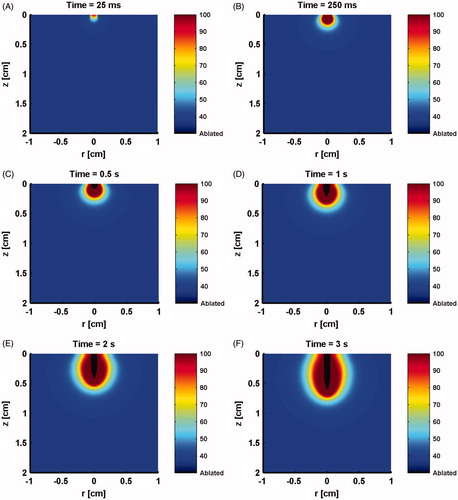
Figure 6. Tissue laser ablation outcomes evaluated in terms of (A) coagulation depth and (B) ablation rate after irradiating with 10 W CW mode and pulsed mode lasers at selected pulse durations and pulse frequencies.
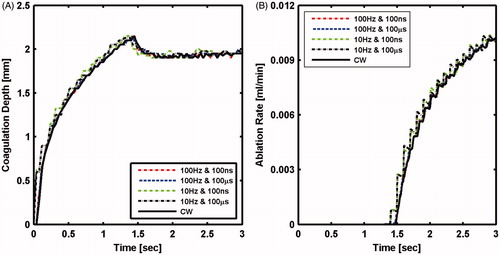
Figure 7. Tissue laser ablation outcomes evaluated in terms of (A) coagulation depth; (B) coagulation zone thickness; and (C) ablation rate after irradiating with 100 W CW mode and pulsed mode lasers at selected pulse durations and pulse frequencies.
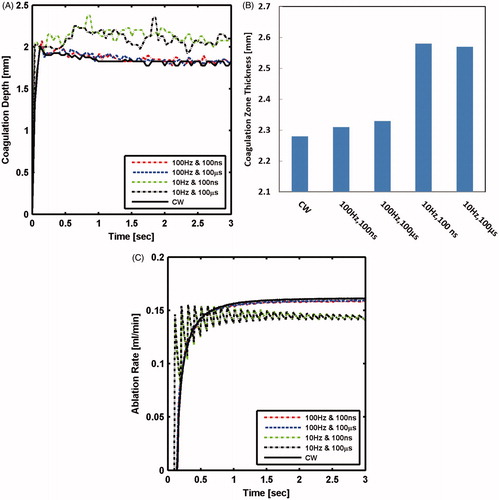
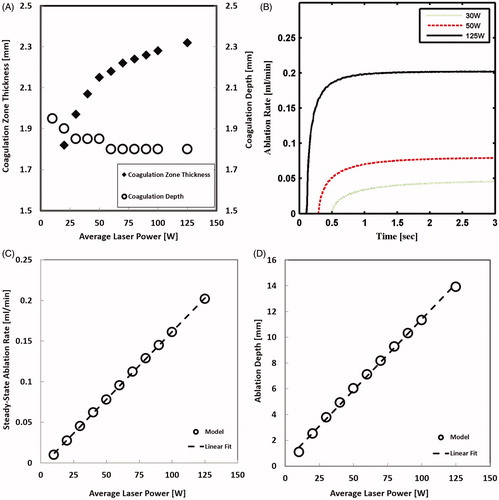
Figure 8. Tissue laser ablation outcome evaluated in terms of (A) coagulation zone thickness and coagulation depth, (B) ablation rate (C) steady-state ablation rate, and (D) ablation depth after irradiating with CW mode laser using different power settings.