
Figures & data
Figure 1. Schematic workflow of interstitial hyperthermia which consists of preplanning, catheter implantation, reconstruction, hyperthermia treatment planning, treatment with heat up phase (I), therapeutic phase (II) and cool down phase (III), and finally documentation.
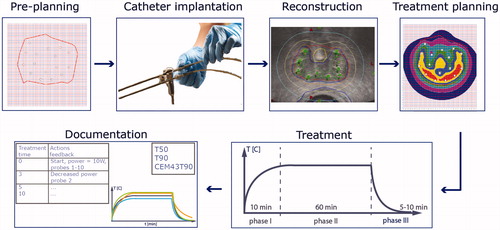
Table 1. Recommended minimum number* of temperature probes.
Table 2. Comparison of device characteristics for four interstitial heating modalities.
Figure 2. The two main experimental setups to characterize the heating properties of an interstitial applicator. (a) Schematic setup to determine the effective heating length and the average temperature rise (aTR) in muscle equivalent phantoms, (b) Determination of the effective heating length in a solid phantom and using infrared imaging (ΔTmax ≥ 6 °C), (c) Calorimetric setup to determine the applicator efficacy in a liquid phantom for 6 min heating time. The temperature–time profile must be measured 5 min before and after the heating and continuing during heating while continuously homogenizing the liquid to obtain the correct average temperature. The minimum average ΔT must be 6 °C.
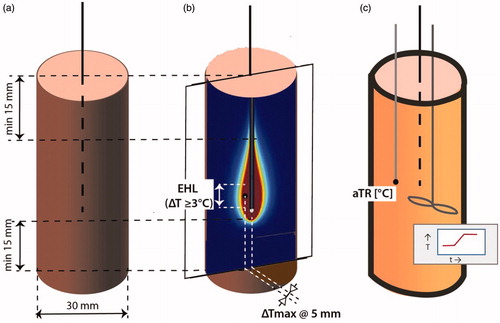
Figure 3. Setup to verify independent performance of three applicators in an array. Experiments are required for three configurations with a different combination of active applicators. (a) Setup to test the independence of the applicators and their generators, consisting of three applicators, each 20 mm apart, and three temperature probes indicated in black, each recording the temperature at 5 mm of the active section of one applicator. (b) Example showing temperature distributions in the horizontal plane at the position of the maxima of Tmax when one, two or three applicators are switched on. Green dots indicate power on, red dots power off.
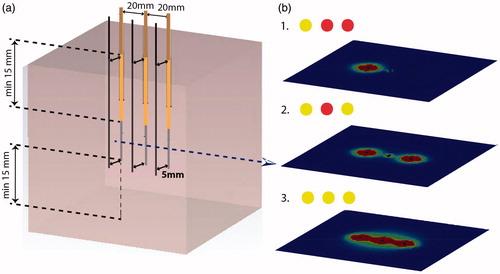
Table (A-1). Classification of hyperthermia specific side effects according to Common Toxicity Criteria Adverse Events (CTCAE) v5.0 and Quality Management in Hyperthermia (QMHT).