Figures & data
Table 1. Previous literature of thermal fixation.
Figure 1. Annotated H&E stained axial whole-mount slide mid from the RALP specimen from every study patient. All patients except patient four presented complete coagulation necrosis of the targeted tumor: the complete irreversible cell death inside the red boundary (CNZ) and margin zone between red and blue boundaries (MZ). Patient 4 presented thermally-fixed viable-looking cells within green boundaries. Black contoured regions present outfield (outside treatment boundaries) residual prostate cancer.
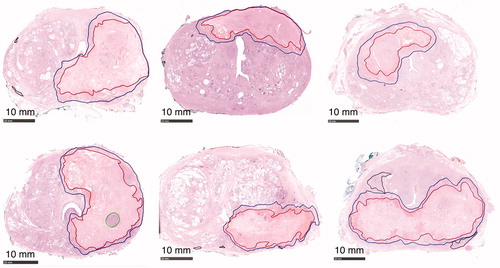
Figure 2. (A) Patient 4: A 70-year-old (ECOG 0, prostate volume 51 cc, BMI 30) Caucasian man without urinary symptoms and with elevated PSA level 36 ng/mL underwent pre-biopsy prostate MRI showing a left lobe situated 5.1 cc PIRADS 5 lesion in the close contact with prostate capsule. Axial, coronal and sagittal T2-weighted images on top panel (left to right in order); diffusion weighted and apparent diffusion coefficient images on bottom panel (left and middle) from the PIRADS 5 lesion. All the MRI-targeted 6-core biopsies confirmed Gleason Score 4 + 3=7 PCa within the dominant lesion with cancer core length of 53 mm. The whole-body contrast-enhanced computer tomography (CT) and bone scintigraphy were both negative for metastasis. F18-prostate-specific membrane antigen (PSMA) positron emission tomography-CT excluded distant metastasis and showed an intensive PSMA-uptake with standardized uptake value maximum of 81.1 g/mL in the left lobe of the prostate concordant with the MRI (on bottom panel left). (B) Immediate post-treatment overlay images have been demonstrated from the active element of the patient 4: on the left targeted region; on the middle maximum temperature and thermal dose maps and on the right non-perfused volume (NPV). Yellow boundary demonstrates targeted region on treatment planning, purple 240 CEM43 isodose boundary and green 55° isotherm boundary. (C) This figure presents post-TULSA NPV on sagittal and axial images at 3 weeks just prior to RALP procedure and the sliced RALP specimen on the right, in which thermal damage region is clearly identified as the dark regions on the gross specimen.
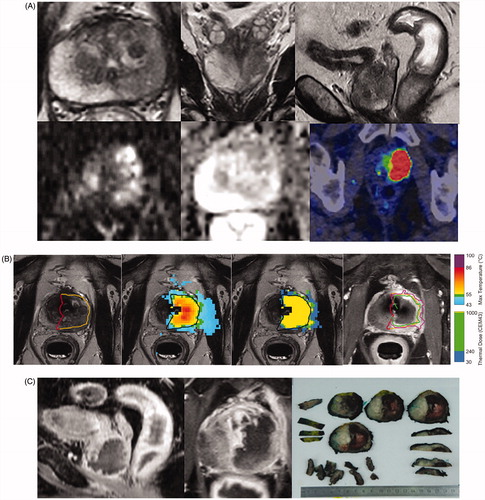
Figure 3. Histological analysis of prostatic thermal injury. An annotated axial H&E-stained whole-mount slide mid from the RALP specimen of the patient four showing the complete irreversible cell death inside the red boundary (CNZ) and margin zone between red and blue boundaries (MZ). Magnification H&E images from thermally-fixed area show well preserved morphology of Gleason 4 adenocarcinoma.
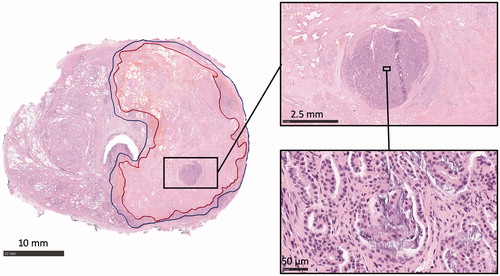
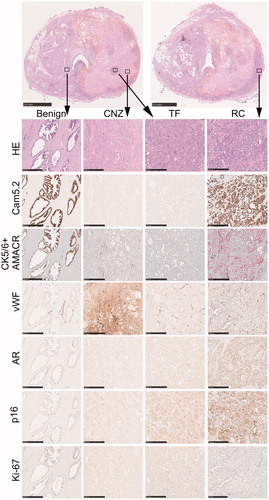
Figure 4. Immunohistochemical staining patterns of different prostatic regions after thermal injury. Two parallel HE-stained macro-sections from mid-prostate are shown from the same patient. High magnification images from benign-untreated region, coagulative necrosis zone (CNZ), thermally-fixed region (TF) and residual carcinoma (RC) with different stainings are shown below, and the defined regions are indicated with squares in the low magnification macro images. Note that there is a loss of cytokeratin 8 (Cam5.2) and AMACR staining in both CNZ and TF regions. A strong extracellular staining for vWF is seen in CNZ, while the staining is restricted to vessels in other regions. AR and p16 are weakly positive in CNZ and TF regions but virtually more abundant in RC region. Scale bar 10 mm for macro-sections, 0.5 mm for high magnification images.