
Figures & data
Figure 1. Flow chart of patient inclusion and exclusion in this study. BTNs: benign thyroid nodules; TA: thermal ablation; ConT: conventional/open thyroidectomy; ET: endoscopic thyroidectomy.
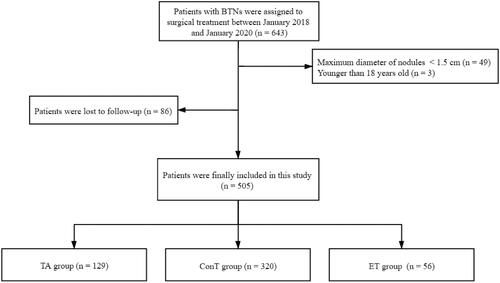
Table 1. Comparison of baseline characteristics of patients with BTNs who underwent TA and ConT therapy before and after propensity score matching.
Table 2. Comparison of baseline characteristics of patients with BTNs who underwent TA and ET therapy before and after propensity score matching.
Figure 2. Ultrasound images of a 48-year-old woman with a BTN before and after RFA. (A) Before RFA, an ultrasound image reveals a solid mixed echo nodule (arrows), with a nodule volume of 7.06 mL. (B) Before RFA, the nodule shows hyper-enhancement (arrows) on a CEUS image of the early phase. (C) Ultrasound image shows insertion of the needle (short arrows) into the nodule and appearance of a hyperechoic ablation zone during RFA (long arrows). (D). Immediately after RFA, the ablation zone (arrows) shows no enhancement on CEUS images. (E) At 1 month after RFA, the volume of the ablation zone (arrows) is 4.01 mL (VRR = 43.2%). (F) At 1 month after RFA, the ablation zone (arrows) shows no enhancement on CEUS images. (G) At 3 months after RFA, an ultrasound image reveals that the volume of the ablation zone (arrows) has decreased to 2.15 mL (VRR = 69.5%). (H) At 12 months after RFA, the volume of the ablation zone (arrows) has decreased to 0.12 mL (VRR = 98.3%). BTN: benign thyroid nodule; RFA: radiofrequency ablation; VRR: volume reduction ratio; CEUS: contrast-enhanced ultrasound.
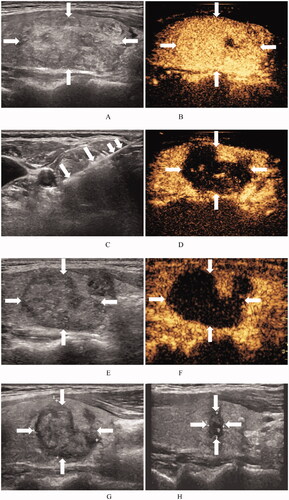
Figure 3. Ultrasound images of a 31-year-old woman with a BTN before and after MWA. (A) Before MWA, an ultrasound image reveals a solid iso-echoic nodule (arrows), with a nodule volume of 23.06 mL. (B) Before MWA, the nodule shows hyper-enhancement (arrows) on CEUS images of the early phase. (C) Ultrasound image shows insertion of the needle (arrows) into the nodule and appearance of a hyperechoic ablation zone (arrows) during MWA. (D) Immediately after MWA, the ablation zone (arrows) shows no enhancement on CEUS images. (E) At 1 month after MWA, an ultrasound image reveals that the volume of the ablation zone (arrows) has decreased to 14.93 mL (VRR = 35.3%). (F) At 1 month after RFA, the ablation zone (arrows) shows no enhancement on CEUS images. (G) At 1 year after MWA, an ultrasound image reveals that the volume of the ablation zone (arrows) is 12.16 mL (VRR = 47.2%). (H) At 1.5 years after MWA, the volume of the ablation zone (arrows) is 12.16 mL (VRR = 47.2%). BTN: benign thyroid nodule; MWA: microwave ablation; CEUS: contrast-enhanced ultrasound; VRR: volume reduction ratio.
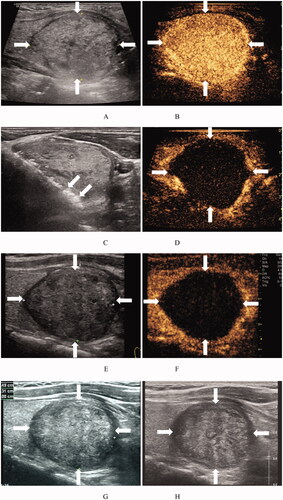
Table 3. Comparison of treatment outcomes between TA and ConT for BTNs after propensity score matching.
Table 4. Comparison of treatment outcomes between TA and ET for BTNs after propensity score matching.
Table 5. Comparison of patient satisfaction between TA and ConT for BTNs based on a telephone survey.
Table 6. Comparison of patient satisfaction between TA and ET for BTNs based on a telephone survey.