
Figures & data
Table 1. Relevant physical properties of the bile duct tissues and the stent alloy.
Figure 1. (a) Model of the bile duct (green) and tumor along with the detail of the 1D structure of the metallic stent. The angles identifying the stent axis are: ψ = 72.5° and θ = 0°. The orientation reference for admissible field directions is indicated in the inset. (b) Full computational model domain.
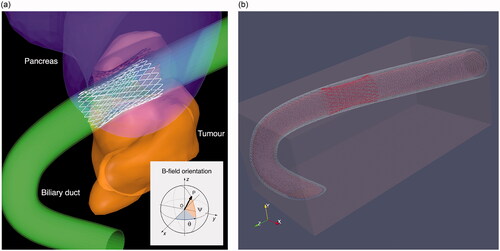
Figure 2. Time evolution of the spatial distribution of ΔT during the exposure to the Bmax field orientation upon exposure after 10 s (a), 60 s (b), 360 s (c), and 1800 s (d). The field amplitude is 5 mT, and the wire diameter is 0.3 mm. The maps refer to the duct full of bile. Two different color maps are used to represent the temperature increase in the tissues and the power density in the stent wires. The black arrow in (a) shows the direction of Bmax (ψ = 52° and θ = 130°).
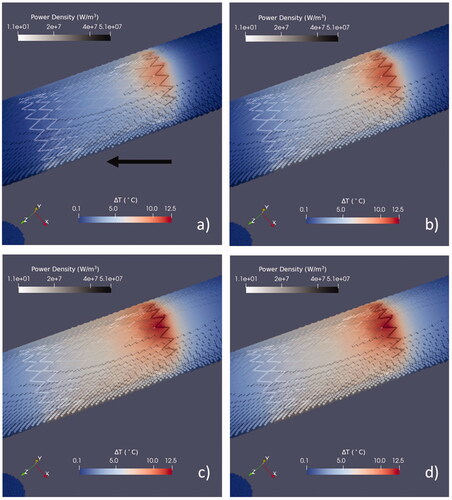
Figure 3. Influence of the magnetic field orientation on the power deposition in the stent and the consequent tissue heating after 30 min of exposure. From the upper plot to the bottom: (a) total power dissipated into the stent, (b) maximum power density in the stent, (c) corresponding maximum temperature increase (ΔTmax) in tissues for an empty duct, (d) corresponding ΔTmax in tissues for a duct full of bile. All the results, obtained at 300 kHz, are reported in p.u. values, where the values of zero correspond to the minimum of the physical quantity, while the value of one correspond to the maximum of the physical quantity.
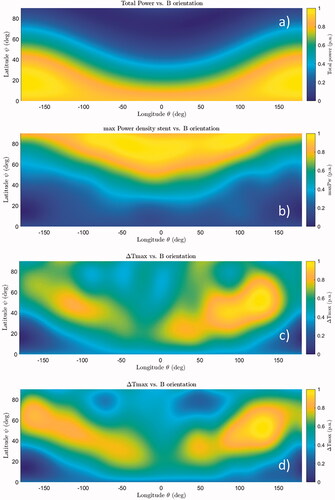
Table 2. ΔTmax (°C) after 30 min of exposure to a 10 mT field calculated for the tissues that make up the bile duct, with or without bile in the duct.
Table 3. ΔTmax (°C) after 30 min of exposure.
Table 4. Amount of tissue mass (milligrams) of a given tissue where the heating exceeds 80% of the maximum temperature increase ΔTmax found in each tissue (ΔTlim = 0.8·ΔTmax).
Table 5. Calculated ΔTmax (°C) for each of the bile duct tissue layers after 30 min exposure to different field intensities along four different orientations.
Table 6. Amount of tissue mass (grams) where the heating exceeds 3 °C, 6 °C, and 9 °C.
Table 7. ΔTmax (°C) after 30 min of exposure.