Figures & data
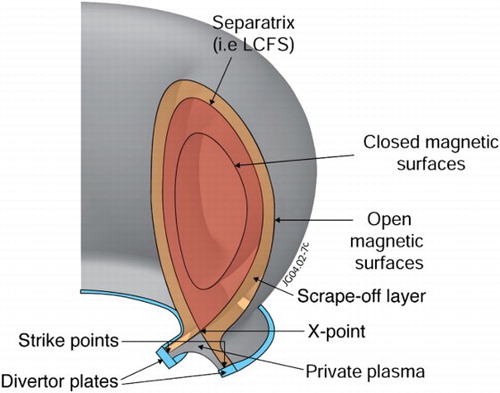
1 Diagram showing geometry of a toroidal magnetic field with a divertor. Source: Eurofusion
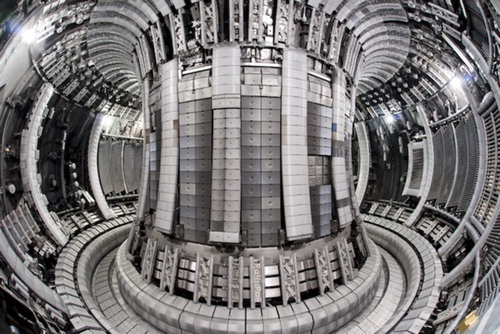
2 Image of JET with tungsten divertor and beryllium first wall. Source: Eurofusion
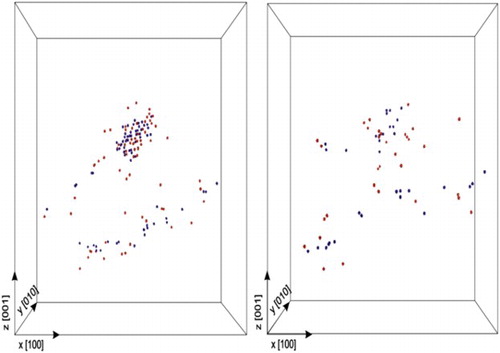
3 Evolution of damage cascades in Tungsten at 5 ps after collision (left) and after 30 ps (right) showing vacancy and interstitial distributionsCitation17
4 TEM images of voids in tungsten (taken from Ferroni et al.Citation27)
Table 1. Elemental composition of tungsten after five years in a fusion power plantCitation28
5 Phase diagram and Helmholtz free energy curves for W–Re (taken from Ekman et al.Citation30)
6 Fracture testing of micro-cantilever in tungsten (taken from Armstronget al.Citation33)
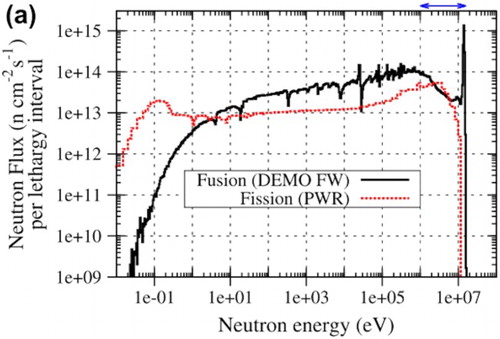
7 Neutron spectra for a fusion power plant and current fission reactors (taken from Gilbert et al.Citation37)
8 TEM micrograph showing both acicular and circular precipitates formed by neutron irradiation of W–11Re at 1173 KCitation41
9 TEM micrographs showing voids in tungsten irradiated at a 0.17 dpa at 673 K, b 0.96 dpa at 701 K, c 0.40 dpa at 1013 K andd 1.54 dpa at 1023 KCitation51
10 TEM micrographs showing pure tungsten after irradiation to 0.98 dpa at 1073 K: a diffraction pattern from (001), b bright-field image, and c and d dark-field images of precipitatesCitation46
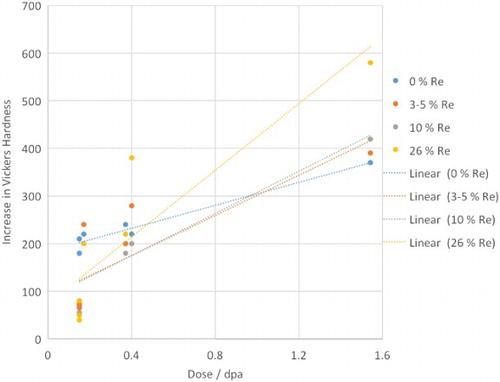
11 Increase in hardness of W–x Re with increase neutron dose across a range of temperatures, increasing rhenium content increases the rate of hardening due to precipitate formation. Reproduced with data from Tanno et al.Citation45 and He et al.Citation55
12 TEM micrographs showing steady formation and growth of interstitial loops over 0.3 s and sudden appearance of vacancy loopsCitation21
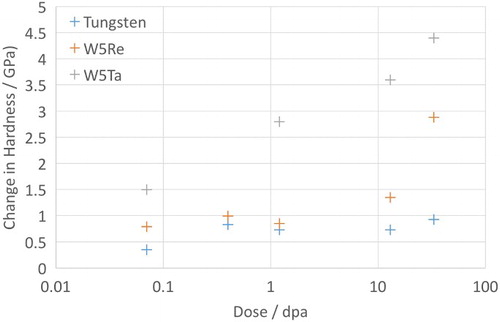
13 Hardening of tungsten and tungsten alloys under self-ion irradiationCitation66,Citation68
14 Tungsten fuzz formed by exposure to He containing plasma on PISCES BCitation72
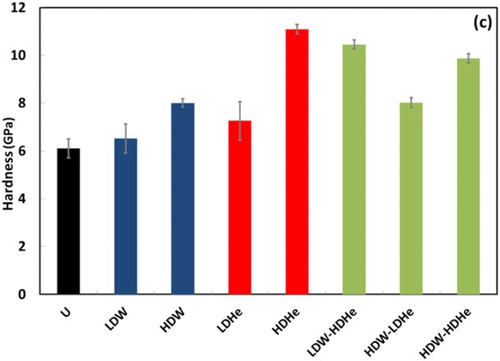
15 Hardness measurements from tungsten irradiated with self-ions to 0.02 dpa (LDW) or 0.25 dpa (HDW) and He to 300 appm (LDHe) or 3000 appm (HDHe)Citation80
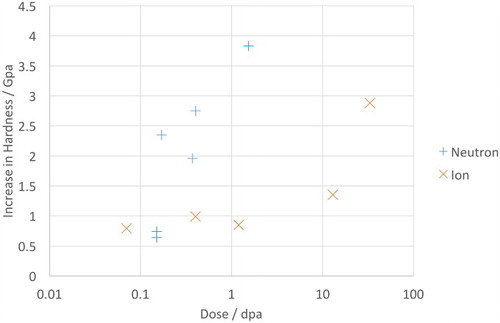
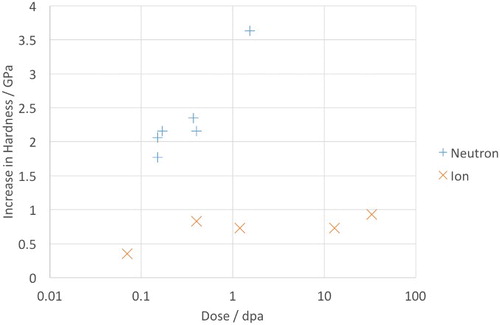
16 Hardness measurements comparing ion and neutron irradiation for pure tungstenCitation45,Citation55,Citation66
17 Hardness measurements comparing ion and neutron irradiation for W– 5% ReCitation45,Citation55,Citation66