
Figures & data
Figure 1. Schematic illustration of the method to determine the critical hydrogen concentration in sustained loading delayed fracture.
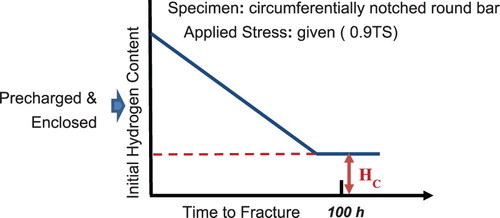
Figure 2. Dependence of KISCC on (a) tempering temperature and (b) internal strain estimated from X-ray line broadening for medium carbon Cr–Mo martensitic steels. (A) 0.04Nb, (B) 0.04Ti + 0.10V or (C) 0.10V + 0.04Nb (mass%) added to the base compositions [Citation32]. (The numerical values in the abscissa of Figure (b) may not be correct.)
![Figure 2. Dependence of KISCC on (a) tempering temperature and (b) internal strain estimated from X-ray line broadening for medium carbon Cr–Mo martensitic steels. (A) 0.04Nb, (B) 0.04Ti + 0.10V or (C) 0.10V + 0.04Nb (mass%) added to the base compositions [Citation32]. (The numerical values in the abscissa of Figure 1(b) may not be correct.)](/cms/asset/45e9d917-b409-43d9-93fc-b89a90ec9c9a/ymst_a_1639009_f0002_ob.jpg)
Figure 3. Strain-rate dependencies of (a) relative reduction in area in tensile tests for specimens containing [Peak#1 + Peak#2] hydrogen and only [Peak#2] hydrogen, and (b) difference in Peak#1 hydrogen, ΔCH, between specimens strained to 0.08 with and without hydrogen for [Peak#1 + Peak#2] and [Peak#2] series [Citation41].
![Figure 3. Strain-rate dependencies of (a) relative reduction in area in tensile tests for specimens containing [Peak#1 + Peak#2] hydrogen and only [Peak#2] hydrogen, and (b) difference in Peak#1 hydrogen, ΔCH, between specimens strained to 0.08 with and without hydrogen for [Peak#1 + Peak#2] and [Peak#2] series [Citation41].](/cms/asset/fd7f222b-f6d4-466b-b128-10de0403652d/ymst_a_1639009_f0003_ob.jpg)
Figure 4. Temperature dependencies of (a) relative reduction in area in tensile tests for specimens containing [Peak#1 + Peak#2] hydrogen and only [Peak#2] hydrogen, and (b) difference in Peak#1 hydrogen, ΔCH, between specimens strained to 0.08 with and without hydrogen for [Peak#1 + Peak#2] and [Peak#2] series [Citation41].
![Figure 4. Temperature dependencies of (a) relative reduction in area in tensile tests for specimens containing [Peak#1 + Peak#2] hydrogen and only [Peak#2] hydrogen, and (b) difference in Peak#1 hydrogen, ΔCH, between specimens strained to 0.08 with and without hydrogen for [Peak#1 + Peak#2] and [Peak#2] series [Citation41].](/cms/asset/07d7d339-1c6a-408b-94f1-bc93630297e4/ymst_a_1639009_f0004_ob.jpg)
Figure 5. Tensile curves of high-strength steels given sustained loading at 0.8 of the tensile strength for 96 h with hydrogen charging. Tensile tests were conducted after degassing hydrogen at 303 K for 168 h. Tensile curves of specimens annealed at 473 K for 2 h after [H + prestress + 200°C] or without [Non-prestressin + 200°C] prestressing are also shown for comparison [Citation44].
![Figure 5. Tensile curves of high-strength steels given sustained loading at 0.8 of the tensile strength for 96 h with hydrogen charging. Tensile tests were conducted after degassing hydrogen at 303 K for 168 h. Tensile curves of specimens annealed at 473 K for 2 h after [H + prestress + 200°C] or without [Non-prestressin + 200°C] prestressing are also shown for comparison [Citation44].](/cms/asset/0bbc6cb3-bd9e-498f-acd3-2d5266d685b0/ymst_a_1639009_f0005_ob.jpg)
Figure 6. Tensile test after cyclic prestressing. (a) Schematic illustration of cyclic prestressing of different strain rates with/without hydrogen charging. Tensile test was conducted at constant strain rate. (b) Degradation of fracture strain at the tensile test affected by cyclic prestressing under hydrogen precharging [Citation48].
![Figure 6. Tensile test after cyclic prestressing. (a) Schematic illustration of cyclic prestressing of different strain rates with/without hydrogen charging. Tensile test was conducted at constant strain rate. (b) Degradation of fracture strain at the tensile test affected by cyclic prestressing under hydrogen precharging [Citation48].](/cms/asset/3496fb77-2a7b-4b56-a229-92094f8b3f19/ymst_a_1639009_f0006_ob.jpg)
Figure 7. (a) Hydrogen enhancement of the generation of defects on cyclic stressing with increasing stress cycles at different strain rates. (b) Relationship between HES and ΔCH at different strain rates at prestressing [Citation48].
![Figure 7. (a) Hydrogen enhancement of the generation of defects on cyclic stressing with increasing stress cycles at different strain rates. (b) Relationship between HES and ΔCH at different strain rates at prestressing [Citation48].](/cms/asset/ae52b5fc-43c8-4392-8dec-9b0bdb4299ea/ymst_a_1639009_f0007_ob.jpg)