Figures & data
Table 1. Countries included in the sample.
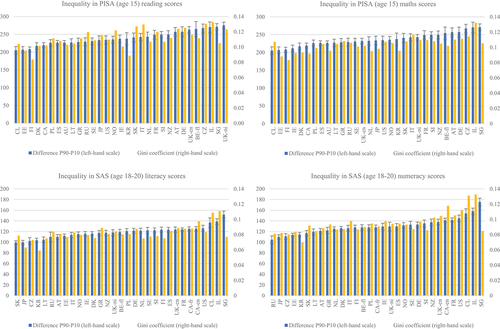
Figure 1. Gini coefficients of inequality for scores in reading/literacy and maths/numeracy by country/territory (PISA – 15-year-olds and SAS – 18-20-year-olds).
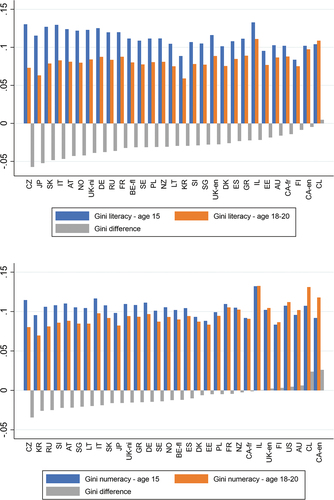
Figure 2. Gini coefficients of inequality for scores in reading/literacy and maths/numeracy by system type (PISA – 15-year-olds and SAS – 18-20-year-olds).
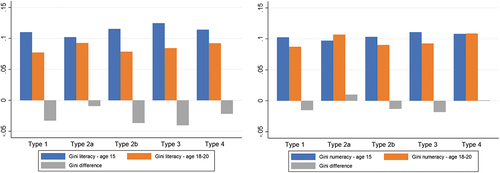
Figure 3. Main system characteristics – duration of upper secondary, curriculum standardisation, stage at first selection, vocational prevalence, vocational specificity and teaching hours per week – by country/territory and system type.
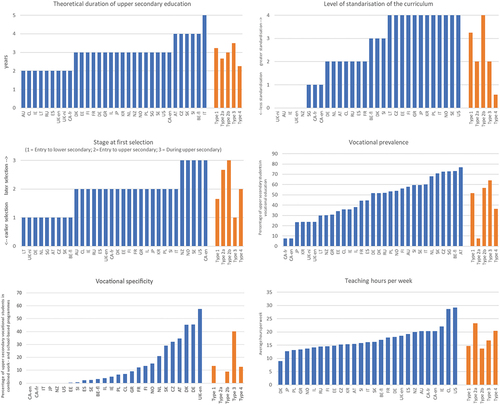
Table 2. OLS and DID estimates for the effect of system type on inequality in literacy/numeracy.
Table 3. OLS and DID estimates for the effect of system characteristics on inequality in literacy/numeracy.
Table A1 OLS and DID estimates for the effect of 12 system characteristics on inequality in literacy/numeracy.
Table A2 Skills inequalities in PISA and SAS.
Figure A1 Skills inequalities in PISA and SAS