
Figures & data
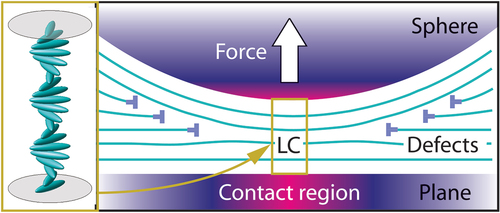
Figure 1. (a) Schematic illustration of the SFA setup showing the two curved surfaces and the optical path through them. Adapted with permission from [Citation13]. Copyright 1997 American Chemical Society. (b) Schematic of the AFM setup showing a tip in contact with a surface. Reprinted from [Citation10]. Copyright 2011, with permission from Elsevier.
![Figure 1. (a) Schematic illustration of the SFA setup showing the two curved surfaces and the optical path through them. Adapted with permission from [Citation13]. Copyright 1997 American Chemical Society. (b) Schematic of the AFM setup showing a tip in contact with a surface. Reprinted from [Citation10]. Copyright 2011, with permission from Elsevier.](/cms/asset/6eb02524-009b-4ef4-a5a6-7ce99dd2a135/tlct_a_2358443_f0001_b.gif)
Figure 2. (a) Crossed cylindrical surfaces in the SFA. x and y are the cylinder axes, and z is the common surface normal at the contact position (x, y = 0), indicated with an ellipse. D and R are the mica-mica separation distance and cylinder radius, respectively. The surface geometry approximates a sphere and plane around the contact position (x, y << R). Planar anchoring conditions are indicated with rods and induce splay and bend far from the contact position. (b) Optical multilayer at the contact position. The thickness of Ag coating on the mica surfaces is (30 –60) nm. n is the LC director having polar and azimuthal angles ϕ and θ, respectively, relative to the xyz reference frame. u is the projection of n in the xy-plane of the surfaces. γ1 and γ2 are the slow optic axes of the mica surfaces, making an angle ψ with each other. Reprinted from [Citation11] with the permission of AIP Publishing.
![Figure 2. (a) Crossed cylindrical surfaces in the SFA. x and y are the cylinder axes, and z is the common surface normal at the contact position (x, y = 0), indicated with an ellipse. D and R are the mica-mica separation distance and cylinder radius, respectively. The surface geometry approximates a sphere and plane around the contact position (x, y << R). Planar anchoring conditions are indicated with rods and induce splay and bend far from the contact position. (b) Optical multilayer at the contact position. The thickness of Ag coating on the mica surfaces is (30 –60) nm. n is the LC director having polar and azimuthal angles ϕ and θ, respectively, relative to the xyz reference frame. u is the projection of n in the xy-plane of the surfaces. γ1 and γ2 are the slow optic axes of the mica surfaces, making an angle ψ with each other. Reprinted from [Citation11] with the permission of AIP Publishing.](/cms/asset/412c7325-0c89-4456-968a-6ab24583e122/tlct_a_2358443_f0002_oc.jpg)
Figure 3. Examples of FECOs created by an LC in the SFA optical cavity. λ and r are the optical wavelength and lateral distance from the contact position (dashed line), respectively. At each position r, the LC birefringence creates a resonance doublet with wavelengths λ1 and λ2 that increase almost proportionally with the film thickness. In this example, a defect loop with radius rd (indicated with yellow solid lines) in a cholesteric LC annihilates at the contact position as the surfaces are separated going from figure a to C. n is the number of helical half-turns (π-rotations) at the contact. Reprinted from [Citation33].
![Figure 3. Examples of FECOs created by an LC in the SFA optical cavity. λ and r are the optical wavelength and lateral distance from the contact position (dashed line), respectively. At each position r, the LC birefringence creates a resonance doublet with wavelengths λ1 and λ2 that increase almost proportionally with the film thickness. In this example, a defect loop with radius rd (indicated with yellow solid lines) in a cholesteric LC annihilates at the contact position as the surfaces are separated going from figure a to C. n is the number of helical half-turns (π-rotations) at the contact. Reprinted from [Citation33].](/cms/asset/a2310183-5fa8-4830-989f-bd138aee788b/tlct_a_2358443_f0003_oc.jpg)
Figure 4. AFM measurements of the normal force F as a function of the surface separation distance D in the isotropic phase of 5CB confined between a spherical glass probe with radius R ≈5 μm and a glass slide, both coated with DMOAP. TNI is the nematic-isotropic transition temperature. The dashed and solid lines are the van der Waals attraction and the total theoretical force, respectively. Reprinted figure with permission from [Citation59]. Copyright 2001 by the American Physical Society.
![Figure 4. AFM measurements of the normal force F as a function of the surface separation distance D in the isotropic phase of 5CB confined between a spherical glass probe with radius R ≈5 μm and a glass slide, both coated with DMOAP. TNI is the nematic-isotropic transition temperature. The dashed and solid lines are the van der Waals attraction and the total theoretical force, respectively. Reprinted figure with permission from [Citation59]. Copyright 2001 by the American Physical Society.](/cms/asset/7fcb0427-cc81-4610-8691-9d37f3d274f6/tlct_a_2358443_f0004_b.gif)
Figure 5. Oscillatory force-distance curves measured under homeotropic anchoring conditions. (a) Nematic phase of a 37-wt.% CsPFO-water solution between mica surfaces, studied with the SFA. ξ is the correlation length of the surface-induced positional order. The solid line represents the theoretical curve (EquationEq. 6(6)
(6) ). Reprinted figure with permission from [Citation67]. Copyright 1996 by the American Physical Society. (b) Isotropic 8CB between two DMOAP-coated glass surfaces, studied with colloidal-probe AFM. Reprinted figure with permission from [Citation65]. Copyright 2000 by the American Physical Society.
![Figure 5. Oscillatory force-distance curves measured under homeotropic anchoring conditions. (a) Nematic phase of a 37-wt.% CsPFO-water solution between mica surfaces, studied with the SFA. ξ is the correlation length of the surface-induced positional order. The solid line represents the theoretical curve (EquationEq. 6(6) G=aξψ02tanh(D/2ξ)−1+1−cos(ε)sin(D/ξ)(6) ). Reprinted figure with permission from [Citation67]. Copyright 1996 by the American Physical Society. (b) Isotropic 8CB between two DMOAP-coated glass surfaces, studied with colloidal-probe AFM. Reprinted figure with permission from [Citation65]. Copyright 2000 by the American Physical Society.](/cms/asset/0c246663-4d22-4c7b-8cd0-9aae0b0116a4/tlct_a_2358443_f0005_b.gif)
Figure 6. Oscillatory force-distance curves obtained by confining a nematic between mica surfaces that induced twisted planar anchoring. (a) Measurements in 5CB. The insert shows the peak-to-peak amplitude of the oscillations. Reproduced with permission from ref [Citation60]. (b) Layering in the nematic phase of dimeric 8CB. Open and filled symbols indicate surface approach and retraction, respectively. The confined structure is shown schematically in (c). Adapted with permission from [Citation19]. Copyright 1996 American Chemical Society.
![Figure 6. Oscillatory force-distance curves obtained by confining a nematic between mica surfaces that induced twisted planar anchoring. (a) Measurements in 5CB. The insert shows the peak-to-peak amplitude of the oscillations. Reproduced with permission from ref [Citation60]. (b) Layering in the nematic phase of dimeric 8CB. Open and filled symbols indicate surface approach and retraction, respectively. The confined structure is shown schematically in (c). Adapted with permission from [Citation19]. Copyright 1996 American Chemical Society.](/cms/asset/05036f07-2da4-45a8-b192-f7d9bedda661/tlct_a_2358443_f0006_b.gif)
Figure 7. (a) Colloidal-probe AFM measurements of the normal force F measured for isotropic 5CB confined between a colloidal probe with radius R ≈10 μm and a glass substrate at a distance D apart. The probe and substrate were coated with DMOAP to induce homeotropic anchoring. (b) Distance-temperature phase diagram showing capillary condensation as an isotropic-nematic transition line ending in a critical point. Reprinted figure with permission from [Citation72]. Copyright 2001 by the American Physical Society.
![Figure 7. (a) Colloidal-probe AFM measurements of the normal force F measured for isotropic 5CB confined between a colloidal probe with radius R ≈10 μm and a glass substrate at a distance D apart. The probe and substrate were coated with DMOAP to induce homeotropic anchoring. (b) Distance-temperature phase diagram showing capillary condensation as an isotropic-nematic transition line ending in a critical point. Reprinted figure with permission from [Citation72]. Copyright 2001 by the American Physical Society.](/cms/asset/232ac86d-8b21-4f03-b7e6-68655660550d/tlct_a_2358443_f0007_b.gif)
Figure 8. Force-distance curves obtained with the SFA for nematic 5CB confined between two mica surfaces, inducing twisted planar anchoring conditions, or two CTAB-coated mica surfaces, inducing homeotropic anchoring. R ≈2 cm is the surface radius of curvature. ψ is the angle between the slow optic axes of the mica surfaces (see ). The thick red line is the theoretical elastic force obtained from EquationEq. 10(10)
(10) with Ψ0 = 90° and Kt = 3.2 pN [Citation78]. Adapted with permission from [Citation77]. Copyright 2012 American Chemical Society.
![Figure 8. Force-distance curves obtained with the SFA for nematic 5CB confined between two mica surfaces, inducing twisted planar anchoring conditions, or two CTAB-coated mica surfaces, inducing homeotropic anchoring. R ≈2 cm is the surface radius of curvature. ψ is the angle between the slow optic axes of the mica surfaces (see Figure 2(b)). The thick red line is the theoretical elastic force obtained from EquationEq. 10(10) F/R =πKtΨ02/D(10) with Ψ0 = 90° and Kt = 3.2 pN [Citation78]. Adapted with permission from [Citation77]. Copyright 2012 American Chemical Society.](/cms/asset/6d78cdb0-b179-486c-b36f-a698b998c009/tlct_a_2358443_f0008_oc.jpg)
Figure 9. (a) Director configurations for a nematic LC film confined under hybrid homeotropic-planar anchoring conditions. The ellipses represent the tensor ellipsoid in the plane of the anchoring directions. (b-c) SFA measurements of the normal force F as a function of the surface separation distance D for nematic 5CB confined between one CTAB-coated and one uncoated mica surface. The Inset in (b) shows oscillations with a period d_0 about 0.5 nm due to planar layering. The red triangles in (c) indicate points of maximum force from where the surfaces jumped into adhesive contact and reached a distance D of about 1 nm. (a,b) Adapted with permission from [Citation35,Citation77]. Copyright 2012 American Chemical Society. (c) Reprinted figure with permission from [Citation35]. Copyright 2005 by the American Physical Society. (d) AFM force-distance measurement for 5CB confined between a mica surface and a DMOAP-coated colloidal probe. The solid line fits the elastic curve for the director rotation model, whereas the dashed line is calculated using the Landau-De Gennes tensor model. Reprinted figure with permission from [Citation93]. Copyright 2009 by the American Physical Society.
![Figure 9. (a) Director configurations for a nematic LC film confined under hybrid homeotropic-planar anchoring conditions. The ellipses represent the tensor ellipsoid in the plane of the anchoring directions. (b-c) SFA measurements of the normal force F as a function of the surface separation distance D for nematic 5CB confined between one CTAB-coated and one uncoated mica surface. The Inset in (b) shows oscillations with a period d_0 about 0.5 nm due to planar layering. The red triangles in (c) indicate points of maximum force from where the surfaces jumped into adhesive contact and reached a distance D of about 1 nm. (a,b) Adapted with permission from [Citation35,Citation77]. Copyright 2012 American Chemical Society. (c) Reprinted figure with permission from [Citation35]. Copyright 2005 by the American Physical Society. (d) AFM force-distance measurement for 5CB confined between a mica surface and a DMOAP-coated colloidal probe. The solid line fits the elastic curve for the director rotation model, whereas the dashed line is calculated using the Landau-De Gennes tensor model. Reprinted figure with permission from [Citation93]. Copyright 2009 by the American Physical Society.](/cms/asset/a3b2e8b2-2f83-4668-a706-ac7001a1d2a2/tlct_a_2358443_f0009_oc.jpg)
Figure 10. (a) Force-distance curve measured with the SFA for the lamellar phase of SDS [Citation98,Citation99]. Black and white circles indicate surface approach and retraction, respectively. (b) Enlarged view of the force-distance curve in (a). Arrows indicate jumps over mechanically unstable regions. Adapted with permission from [Citation98]. Copyright 1991 American Chemical Society. (c) Force-distance curve obtained with colloidal-probe AFM on smectic 8CB. The arrows indicate the direction of surface motion. (d) Surface distances Dmin = hn and Dmax= hc,n corresponding to force minima and maxima in figure (c). The linear fit gives a smectic layer thickness of a = (3.2 ± 0.8) nm. Reprinted figures with permission from [Citation100]. Copyright 2011 by the American Physical Society.
![Figure 10. (a) Force-distance curve measured with the SFA for the lamellar phase of SDS [Citation98,Citation99]. Black and white circles indicate surface approach and retraction, respectively. (b) Enlarged view of the force-distance curve in (a). Arrows indicate jumps over mechanically unstable regions. Adapted with permission from [Citation98]. Copyright 1991 American Chemical Society. (c) Force-distance curve obtained with colloidal-probe AFM on smectic 8CB. The arrows indicate the direction of surface motion. (d) Surface distances Dmin = hn and Dmax= hc,n corresponding to force minima and maxima in figure (c). The linear fit gives a smectic layer thickness of a = (3.2 ± 0.8) nm. Reprinted figures with permission from [Citation100]. Copyright 2011 by the American Physical Society.](/cms/asset/451a4fcf-6d98-489f-8cb0-93019b0d18b5/tlct_a_2358443_f0010_oc.jpg)
Figure 11. Array of concentric dislocation loops (T-symbols) in a 1d-periodic LC confined between a plane and a sphere of radius R at a distance D apart. r is the lateral distance from the centre of the contact position (r = 0). hn is the film thickness of an uncompressed stack of n layers and ri is the radius of the loop separating two regions with ni-1 and ni = n0 + i layers, where n0 is the number of layers at the contact position. (a) Top view along the plane normal z. (b) Side view across the rz plane. Adapted from ref [Citation33].
![Figure 11. Array of concentric dislocation loops (T-symbols) in a 1d-periodic LC confined between a plane and a sphere of radius R at a distance D apart. r is the lateral distance from the centre of the contact position (r = 0). hn is the film thickness of an uncompressed stack of n layers and ri is the radius of the loop separating two regions with ni-1 and ni = n0 + i layers, where n0 is the number of layers at the contact position. (a) Top view along the plane normal z. (b) Side view across the rz plane. Adapted from ref [Citation33].](/cms/asset/6128312f-f0c3-4f94-8bd8-357521bcc767/tlct_a_2358443_f0011_oc.jpg)
Figure 12. (a) Top-view photograph of an array of dislocation loops in a cholesteric LC confined in the SFA sphere-plane geometry under twisted planar anchoring conditions using mica surfaces. The image was obtained between oblique polarisers. The symbols are explained in . (b) Time-resolved mechanical deformation of the loop array obtained from a sequence of top-view images. The light intensity transmitted along the y-axis of fig. (a) is shown as a function of time, creating a 2d image. The SFA surfaces were approached, left in contact, and then separated by displacing the cantilever at a speed of 3.3 nm/s. New loops with finite radii appeared (white squares and dots) and expanded during surface approach, whereas they shrank and disappeared (black dots) at the contact position (r = 0) during retraction. Adapted from [Citation33].
![Figure 12. (a) Top-view photograph of an array of dislocation loops in a cholesteric LC confined in the SFA sphere-plane geometry under twisted planar anchoring conditions using mica surfaces. The image was obtained between oblique polarisers. The symbols are explained in Figure 11. (b) Time-resolved mechanical deformation of the loop array obtained from a sequence of top-view images. The light intensity transmitted along the y-axis of fig. (a) is shown as a function of time, creating a 2d image. The SFA surfaces were approached, left in contact, and then separated by displacing the cantilever at a speed of 3.3 nm/s. New loops with finite radii appeared (white squares and dots) and expanded during surface approach, whereas they shrank and disappeared (black dots) at the contact position (r = 0) during retraction. Adapted from [Citation33].](/cms/asset/7cd758d9-a460-4fa9-ba05-d323efc1fdea/tlct_a_2358443_f0012_oc.jpg)
Figure 13. (a) Force-distance curves obtained for a cyanobiphenyl-based cholesteric LC using the SFA. White squares and circles indicate loop nucleation events observed in FECOs, whereas black circles indicate loop annihilation. Dotted lines are model curves obtained from Eqs 17 and 19 using a twist constant Kt = 17 pN, twist angles Φ = Ψn (strong anchoring), and a number n of half-turns in the central cell starting from n0. Adapted from [Citation33]. (b) Enlarged view of the small oscillatory forces measured during surface retraction. White circles indicate loop annihilation. The solid black line is the model curve obtained for a half-pitch p = 120 nm and anchoring extrapolation length L << p. Adapted from [Citation116].
![Figure 13. (a) Force-distance curves obtained for a cyanobiphenyl-based cholesteric LC using the SFA. White squares and circles indicate loop nucleation events observed in FECOs, whereas black circles indicate loop annihilation. Dotted lines are model curves obtained from Eqs 17 and 19 using a twist constant Kt = 17 pN, twist angles Φ = Ψn (strong anchoring), and a number n of half-turns in the central cell starting from n0. Adapted from [Citation33]. (b) Enlarged view of the small oscillatory forces measured during surface retraction. White circles indicate loop annihilation. The solid black line is the model curve obtained for a half-pitch p = 120 nm and anchoring extrapolation length L << p. Adapted from [Citation116].](/cms/asset/5bfc37a0-196b-49ad-a6bf-d8b8e44fa49e/tlct_a_2358443_f0013_oc.jpg)
Figure 14. Loop nucleation energy EN as a function of the loop radius ri. The white triangle indicates the first negative minimum obtained by decreasing the surface distance D. Eb is the energy barrier to loop nucleation. The black circle is the last metastable point (minimum) obtained during surface retraction. Adapted from [Citation33].
![Figure 14. Loop nucleation energy EN as a function of the loop radius ri. The white triangle indicates the first negative minimum obtained by decreasing the surface distance D. Eb is the energy barrier to loop nucleation. The black circle is the last metastable point (minimum) obtained during surface retraction. Adapted from [Citation33].](/cms/asset/98722a29-938f-4026-8d21-fa28cf6527b3/tlct_a_2358443_f0014_oc.jpg)