
Figures & data
Figure 1. Versions of the Study Skills MOOC
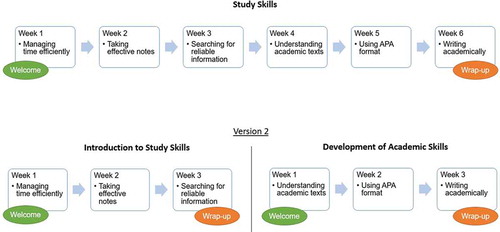
Table 1. Participants in versions 1 and 2 of the MOOC
Table 2. Active participants
Figure 2. Content views
The number of active participants varies in Version 2, as each block had a different number of enrolments and not necessarily the same users. The dotted line indicates the division between blocks in Version 2.
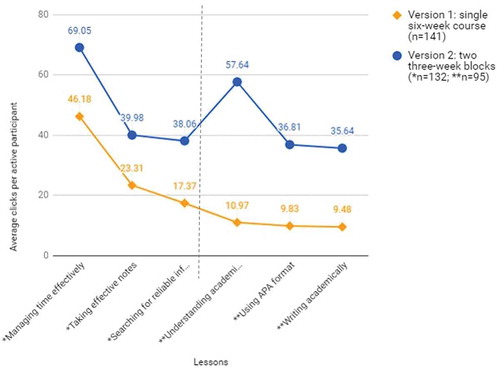
Table 3. Messages posted
Table 4. Completion rate
Figure 3. Participation and retention throughout MOOC delivery
Participation consisted of posting messages, attempting the multiple-choice exercises or answering surveys. Welcome and wrap-up activities were excluded from data and related calculations. The dotted line indicates the division between blocks in Version 2.
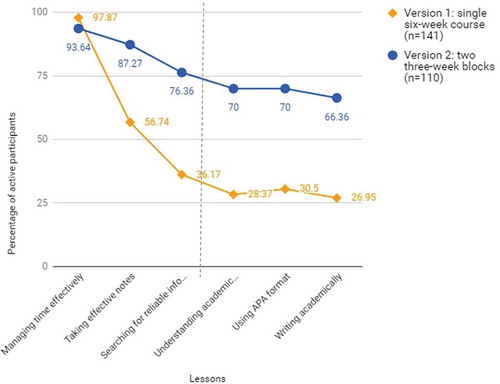
Table 5. General self-efficacy before and after the MOOCs
Table 6. Study skills’ self-efficacy before and after the MOOCs
Table 7. Key themes in participants’ comments
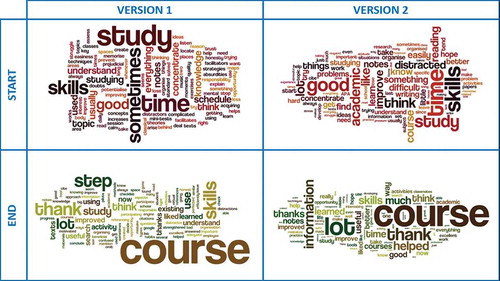
Figure 4. Word clouds of participants’ comments created with Wordle
Supplemental material