2,333
Views
0
CrossRef citations to date
0
Altmetric
Research Article

Education and support for Scottish Independence, 1979-2016

ORCID Icon
Pages 521-542 | Received 24 Aug 2021, Accepted 08 Nov 2021, Published online: 22 Nov 2021

Figures & data

Table 1. Salient educational and political experiences of the birth cohorts.

Table 2. Highest educational attainment, by year of survey.

Figure 1. Percentage supporting Independence, by year of survey and sex, 1979–2016.

Figure 1. Percentage supporting Independence, by year of survey and sex, 1979–2016.

Figure 2. Percentage supporting Independence, by birth cohort and sex, restricted to survey years 2013–16.
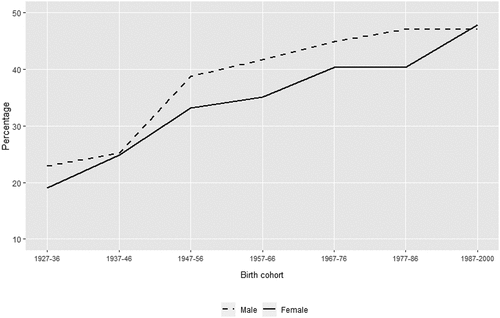
Figure 2. Percentage supporting Independence, by birth cohort and sex, restricted to survey years 2013–16.

Table 3. Highest educational attainment, by birth cohort, restricted to survey years 2013–16.

Figure 3. Predicted percentage supporting Independence, by year of survey, sex and education, 1979–2016.
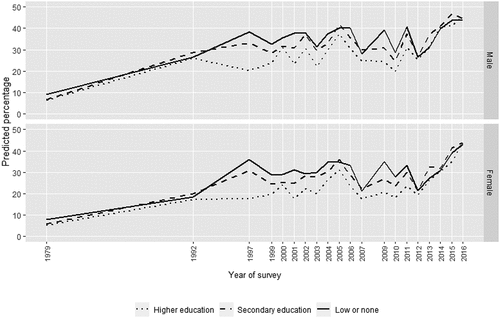
Source: predicted values from model in Table A1.
Figure 3. Predicted percentage supporting Independence, by year of survey, sex and education, 1979–2016.

Figure 4. Predicted percentage supporting independence, by year of survey, sex, birth cohort, and education: birth cohorts -1926 and 1927–36
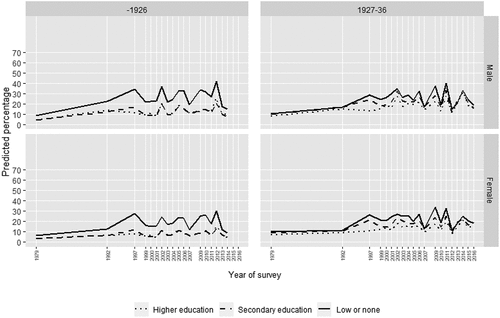
Source: predicted values from model in Table A2. The graphs for the cohort ‘-1926’ are truncated at year 2014 because of very small sample numbers for that cohort after that date.
Figure 4. Predicted percentage supporting independence, by year of survey, sex, birth cohort, and education: birth cohorts -1926 and 1927–36

Figure 5. Predicted percentage supporting Independence, by year of survey, sex, birth cohort, and education: birth cohorts 1937–46 and 1947–56.
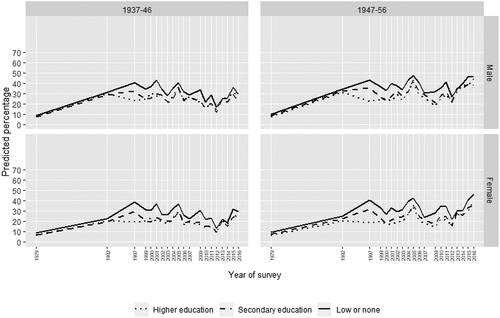
Source: predicted values from model in Table A2.
Figure 5. Predicted percentage supporting Independence, by year of survey, sex, birth cohort, and education: birth cohorts 1937–46 and 1947–56.

Figure 6. Predicted percentage supporting Independence, by year of survey, sex, birth cohort, and education: birth cohorts 1957–66 and 1967–76, and years 1992–2016.
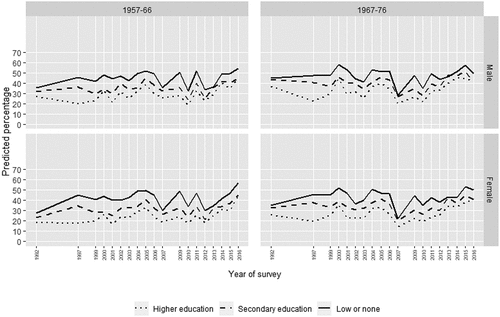
Source: predicted values from model in Table A2.
Figure 6. Predicted percentage supporting Independence, by year of survey, sex, birth cohort, and education: birth cohorts 1957–66 and 1967–76, and years 1992–2016.

Figure 7. Predicted percentage supporting Independence, by year of survey, sex, birth cohort, and education: birth cohorts 1977–86 and 1987–91, and years 2003–16.
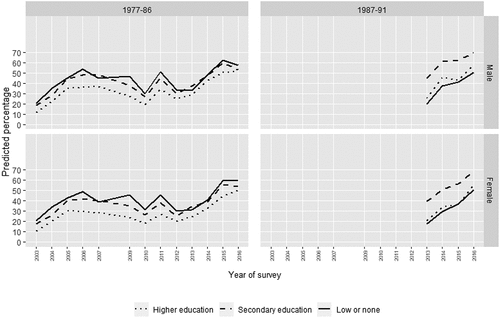
Source: predicted values from model in Table A2.
Figure 7. Predicted percentage supporting Independence, by year of survey, sex, birth cohort, and education: birth cohorts 1977–86 and 1987–91, and years 2003–16.

Figure 8. Predicted percentage supporting Independence among people with Scottish identity, by year of survey, sex, birth cohort, and education: birth cohorts 1927–36, 1957–66, and 1977–86.
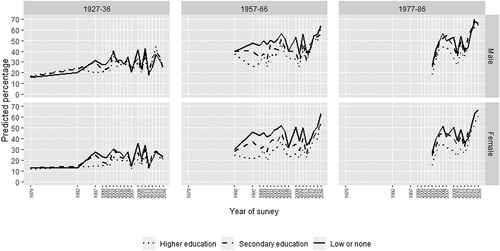
Source: predicted values from model in Table A3.
Figure 8. Predicted percentage supporting Independence among people with Scottish identity, by year of survey, sex, birth cohort, and education: birth cohorts 1927–36, 1957–66, and 1977–86.
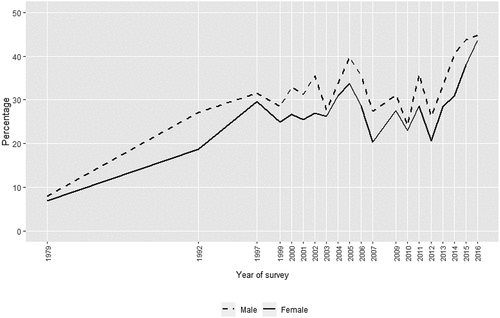
Figure 9. Predicted percentage supporting Independence among people with British identity, by year of survey, sex, birth cohort, and education: birth cohorts 1927–36, 1957–66, and 1977–86.
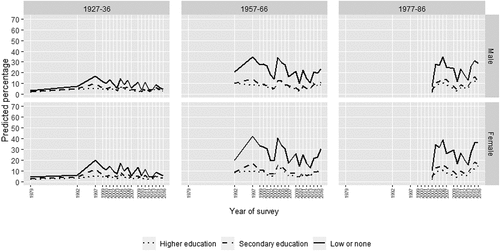
Source: predicted values from model in Table A3.
Figure 9. Predicted percentage supporting Independence among people with British identity, by year of survey, sex, birth cohort, and education: birth cohorts 1927–36, 1957–66, and 1977–86.
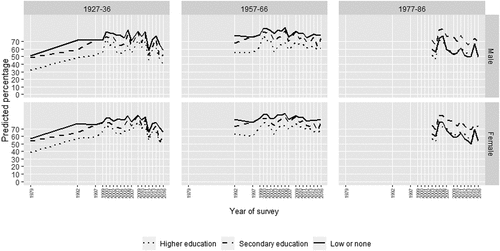
Figure 10. Predicted percentage with Scottish identity, by year of survey, sex, birth cohort, and education: birth cohorts 1927–36, 1957–66, and 1977–86.

Source: predicted values from model in Table A4.
Figure 10. Predicted percentage with Scottish identity, by year of survey, sex, birth cohort, and education: birth cohorts 1927–36, 1957–66, and 1977–86.
Supplemental material

Supplemental Material

Download MS Word (70.6 KB)