
Figures & data
Table 1. SPIO inclusion/exclusion criteria
Figure 1. Flowchart showing the review data selection process adapted from the PRISMA 2020 flow diagram template for systematic reviews (adapted from Page et al., Citation2021a).
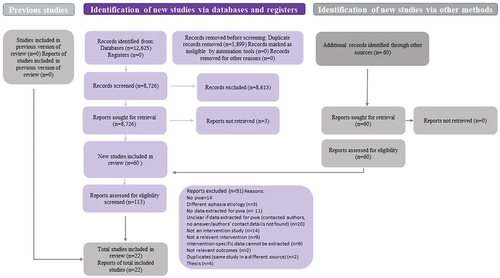
Table 2. Characteristics of included interventions.
Table 3. Summary of measures used for each well-being-related outcome identified.
Figure 2. Revised effect direction plot for quantitative studies including sign test p-values for well-being outcomes, study design, and quality (adapted from Boon & Thomson, Citation2021) .
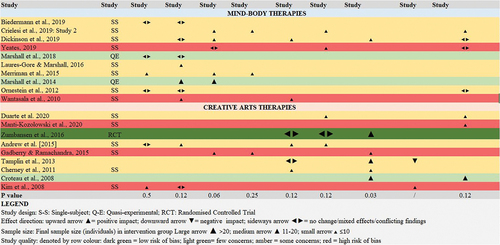
Figure 3. Thematic synthesis process adapted from Suškevičs et al. 2019.
Figure 4. Review analytical themes.
Box 1. Example of search string using boolean operators
Table 4. Theoretical framework: pwa’s perspective on mind-body and creative arts interventions
Table 5. Summary of findings for included studies