
Figures & data
Table 1. Sociodemographic characteristics of the sample.
Figure 1. Density distribution of the performance by task and country.
Note. This figure presents a smooth curve that shows the probability density function, not the observed values. The x-axis shows scores in each test.
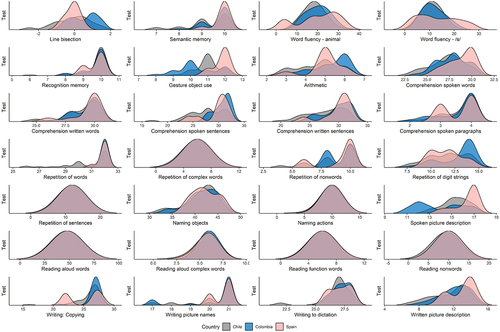
Table 2. Summary of tasks with low Bayes Factor (BF) values.