Figures & data
Table 1. Error types, descriptions, example references and expected IPA transcriptions.
Figure 1. Example ultrasound images for various error types.
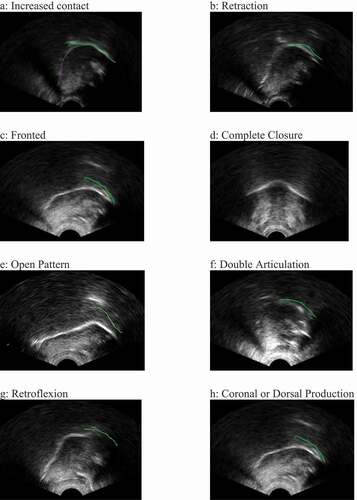
Table 2. Speakers’ demographic information.
Figure 2. Percent of children’s productions rated as always correct by the different types/pairs of transcribers (average of transcriber pair).
Table 3. Agreement between transcribers for rating (1) production as always correct or incorrect, (2) errors as imageable or non-imageable, and (3) classification of error types.
Figure 3. Error types identified by transcriber group/pair (average values of raw count across dataset).