
Figures & data
Table 1. Standardised weights of emotional concern, personal distress, and their interaction component, in accounting for individual differences in accurate emotion recognition, using RMET, AERT, GERT in separate linear hierarchical regression analyses (Study 1, N = 245, Study 2, N = 186).
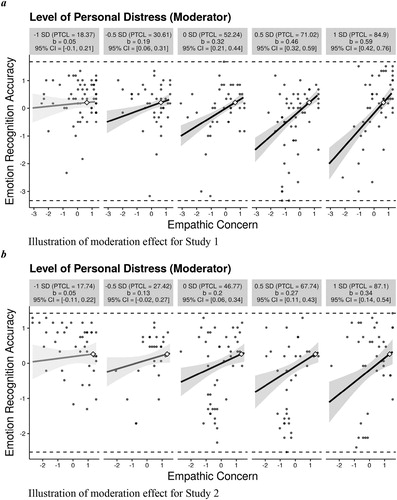
Figure 1. Percentage of accurate emotion recognition (standardized) as a function of individual’s level of empathic concern (standardised), illustrated for very high (+1SD above Mean), high (+0.5SD above Mean), average (at the mean), low (−0. 5SD below Mean) and very low (−1SD below Mean) levels of personal distress. Notes: Slopes are printed bold when significant (p < .05). Accurate emotion recognition assessed by Reading the Mind in the Eyes Test (RMET). Empathic concern and personal distress assessed by Interpersonal Reactivity Index (IRI). Each graphic shows the computed 95% confidence region (shaded area), the full range of the observed data (grey circles) and the threshold at which the association between EC and emotion recognition changes as a function of PD (diamond). CI = confidence interval; PTCL = percentile.
Supplementary_Material
Download MS Word (322.4 KB)Data availability statement
The authors confirm that the data supporting the findings of this study are available within the article or its supplementary materials.