
Figures & data
Table 1. Sample characteristics.
Table 2. Education status of caregivers.
Figure 1. An example trial in the exclusion task.
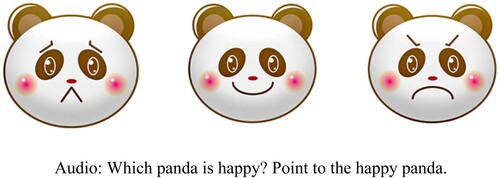
Figure 2. An example trial of the emotion recognition task (mask condition).
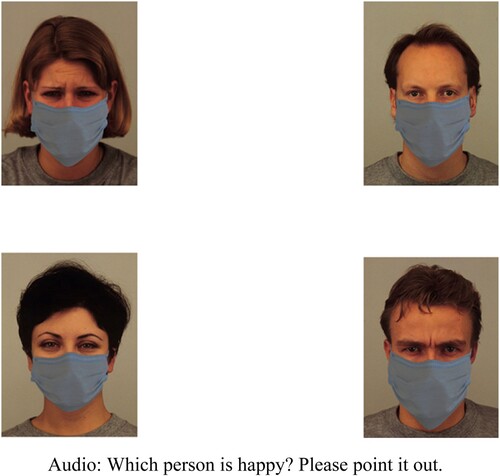
Table 3. The mean and SD of children’s total score on the emotion recognition task.
Table 4. Summary of the logistic regression predicting emotion recognition.
Figure 3 .#Emotion recognition score as a function of emotion, condition and country.
Note. Error bars indicate 95% CI.
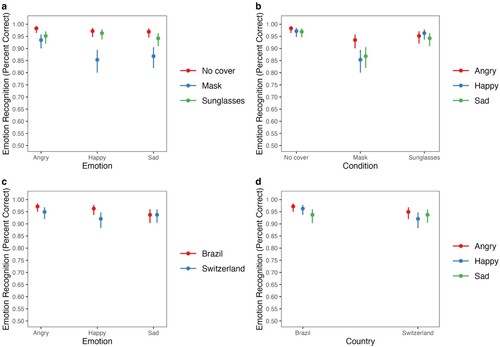
Figure 4. The relationship between country and emotion recognition mediated by the hours of mask exposure.

Supplemental material