
Figures & data
Figure 1. Examples of the experimental trials.
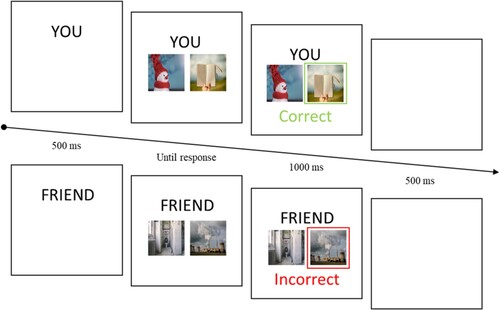
Table 1. Mean response times (ms) and learning performance (%) as a function of Owner and Valence.
Figure 2. Based on ceiling performance during the PST, Learning curves over the first 20 trials as a function of Owner, Valence, and Stimulus Pair. The raw data points represent the observed learning outcomes, and the modelled curves reflect the results of the generalised estimating equations (GEE) analysis. The GEE analysis examines differences in learning trajectories across trials and experimental conditions.
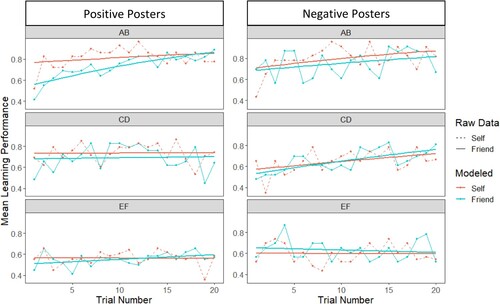
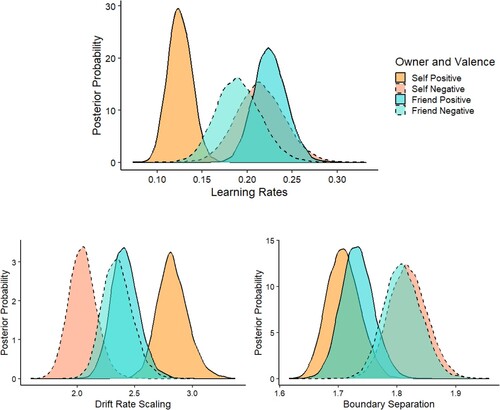
Figure 3. Mean posterior parameter distributions as a function of Owner and Valence for learning rates (η), drift rate scaling (vscaling), and boundary separation (a).
Supplemental Material.docx
Download MS Word (1.7 MB)Data availability statement
The data and stimulus materials are available at https://osf.io/5bswv/.