Figures & data
Figure 1. Geographical location of study area. (a) The Seine river basin, France, and the ‘La Bassée’ alluvial floodplain; (b) study segment showing nase abundance for the 266 samples; and (c) a detail at the downstream limits of the segment.
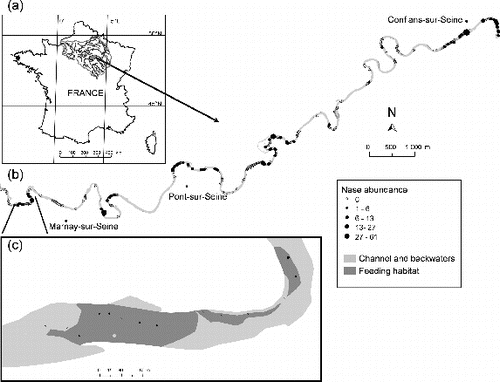
Table 1. Explanatory variables measured or calculated at the sampling unit scale, evaluated for association with the abundance of the species and explanatory variables calculated at the feeding habitat patch scale evaluated for association with the presence/absence of the species.
Figure 2. Spatial variables calculated at two scales. (a) At the sample (i) scale: 1– distance to upstream weir (Distup), 2– distance to the nearest patch of spawning/resting/feeding habitat (DistS, DistR, DistF), 3– proportion of resting (or feeding) habitat in a 120 m square window (PrSR, PrSF) around the sample, 4– proximity index to patches of resting (or feeding) habitat (PxSR, PxSF), Dis is the minimal distance between sample (i) and the patch of resting (or feeding) habitat. (b) At the feeding habitat patch (Fj) scale: 5– patch area (AreaF), 6– proximity index to patches of feeding habitat (PxFF, search distance = 60 m), 7– proximity index to patches of resting habitat (PxFR, search distance = 60 m), Djs is the edge-to-edge longitudinal distance between habitat patches. See for formula.
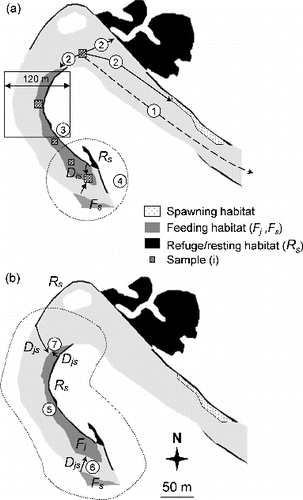
Table 2. Results of the AIC-based selection for models of single variables predicting the most probable abundance of C. nasus and B. barbus from the 266 samples collected at dawn and dusk. Models are ranked from the most plausible (low AIC) to least plausible; only those models that ranked higher than the null model are presented.
Table 3. Results of the AIC-based selection for models that are a combination of the ‘best’ single-variable models predicting the most probable abundance of C. nasus and B. barbus from the 266 samples collected at dawn and dusk. Only models containing non-correlated explanatory variables (Kendall correlation < |0.3|) are proposed.
Table 4. Parameter estimates and significance levels for the best models predicting the most probable abundance of C. nasus and B. barbus from the 266 samples collected at dawn and dusk.
Figure 3. (a) Proximity index to patches of feeding habitat (PxFF) and resting habitat (PxFR), plotted versus their minimal longitudinal distance to upstream weir. (b) Longitudinal distribution of the mean densities (±SD) of >0+ barbel and nase in the 48 patches of feeding habitat, plotted versus their minimal longitudinal distance to upstream weir. White dots indicate patches with null density.
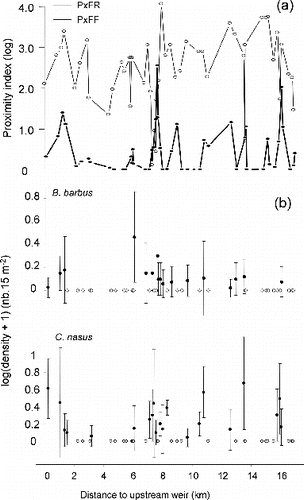
Table 5. Results of the AIC-based selection for models predicting the presence at dawn and dusk of C. nasus and B. barbus within feeding habitat patches (48 patches). Models are ranked from the most plausible (low AIC) to least plausible; only those models that ranked higher than the null model are presented.
Table 6. Parameter estimates and significance levels for the best models predicting the presence at dawn and dusk of C. nasus and B. barbus within feeding habitat patches (48 patches).
Figure 4. Response curves for the probability of presence within feeding habitat patches using GLM models in . Predicted values were computed for the observed ranges of AreaF and PxFF (min/max value) in the ‘La Bassée’ segment.
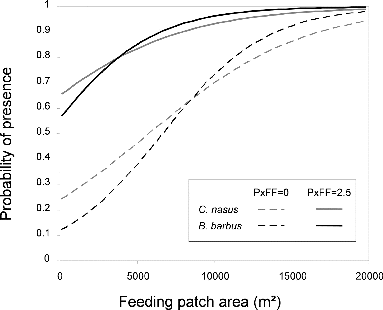
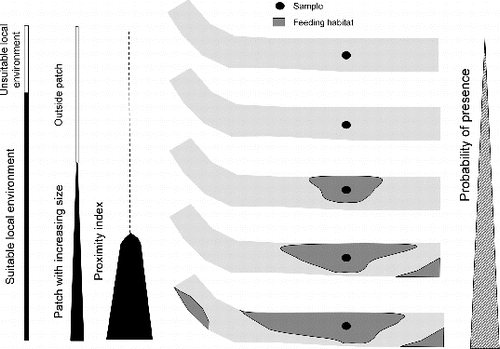
Figure 5. Conceptual model describing the role of local environment and the spatial habitat relationships in explaining the probability of presence of studied species.