Figures & data
Table 1. Characteristics of photoautotrophic periphyton and ash-free dry mass of benthic organic matter collected August 2015 and August 2016. Mean characteristics ± SE of stream sites evaluated the same year are significantly different at the experiment-wise error rate of alpha = 0.05 if they do not share the same letter.
Table 2. Concentrations of total phosphorous of benthic organic matter, soluble reactive phosphorous of water, NO2 + NO3 of water, and total nitrogen of water at stream sites sampled in August 2015 and August 2016.
Table 3. Pearson's correlation coefficients for concentrations of chlorophyll a and ash-free dry mass of benthic organic matter to concentrations of total phosphorous of benthic organic matter and nutrient concentrations of water samples at sites sampled August 2015 and at sites sampled August 2016. Pearson's correlation coefficients are followed by the significance of probability at the 95% confidence level in parentheses.
Table 4. Percent composition of algae groups sampled May 2015, August 2015, May 2016, and August 2016.
Table 5. Most abundant diatom taxa at stream sites sampled in May 2015, August 2015, May 2016, and August 2016. Numbers in parentheses represent percent composition.
Table 6. Percent similarity of diatom assemblages between the different sites sampled May 2015, between the different sites sampled August 2015, between the different sites sampled May 2016, and between the different sites sampled August 2016.
Table 7. Indices and metrics of diatom assemblages at sites sampled in May 2015, August 2015, May 2016, and August 2016.
Table 8. Most abundant soft-algae taxa at sites sampled May 2015, August 2015, May 2016, and August 2016. Numbers in parentheses represent percent composition.
Table 9. Percent similarity of soft-algae assemblages between the different sites sampled May 2015, between the different sites sampled August 2015, between the different sites sampled May 2016, and between the different sites sampled August 2016.
Table 10. Percent similarity of soft-algae and diatom assemblages between the same sites sampled May 2015 and again August 2015, between the same sites sampled May 2016 and again August 2016, and mean ± SE percent similarity of all sites sampled May and again August.
Table 11. Shannon diversity index and metrics for soft-algae assemblages sampled May 2015, August 2015, May 2016, and August 2016.
Figure 1. Values for the algae trophic index using abundance-weighted average of chlorophyll a concentrations (ATIchl a) for soft-algae taxa as the trophic-indicator values of stream sites sampled August 2015 and August 2016.
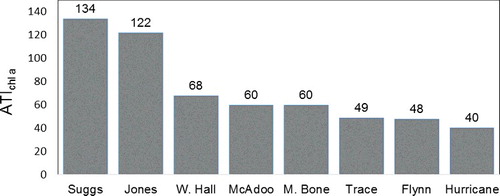
Table 12. Pearson's correlation coefficients for indices of algae assemblages sampled August 2015 and August 2016 to other site characteristics followed by the significance of probability at the 95% confidence level in parentheses. The ATI using soft-taxa abundance-weighted averages of concentrations of chlorophyll (chl) a as the trophic-indicator values is abbreviated ATIchl a. The ATI using abundance-weighted averages of ash-free dry mass of benthic organic matter as the trophic-indicator values is abbreviated ATIAFDM. The ATI using abundance-weighted averages of the concentration of total phosphorous of benthic organic matter as the trophic-indicator values is abbreviated ATITP.
Figure 2. Values for the algae trophic index using abundance-weighted average of ash-free dry mass of benthic organic matter (ATIAFDM) for soft-algae taxa as the trophic-indicator values of stream sites sampled August 2015 and August 2016.
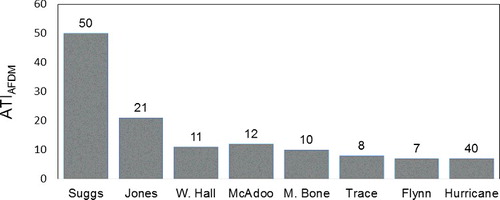
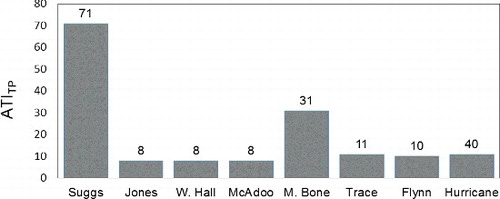
Figure 3. Values for the algae trophic index using abundance-weighted average of the concentrations total phosphorous of benthic organic matter (ATITP) for soft-algae taxa as the trophic-indicator values of stream sites sampled August 2015 and August 2016.