
Figures & data
Figure 1. Map of South Korea, the southern half of the Korean Peninsula bordering the East Sea and Yellow Sea, Northeast Asia; and the location (grey triangles) of the 1,020 study sites (13,366 samples). Thin lines show the five main rivers with national rivers and thick line indicate the four major river basins (Hangang, Nakdonggang, Geumgang, and Yeongsangang-Seomjingang river basin).
Figure 2. Box and whisker plots of measures of Strahler order versus physical characteristics of the classes of streams based on the 1:120,000-scale for stream width (a), altitude (b), stream temperature (c), streambed substratum (d), stream depth (e), and flow velocity (f). Fifth and 95th percentiles (black circles), 10th and 90th percentiles (vertical dashed line), quartiles (box ends), medians (solid horizontal lines within boxes), and averages (dotted horizontal lines within boxes).
Table 1. Spearman's rank correlations (r) among physical environmental variables.
Figure 3. Distribution patterns of FFGs along with stream size characterized by both stream order and stream width. (a) Mean individual abundance/m2 and standard error of CF and SH according to stream order; (b) relative composition (%) of FFG according to stream order; (c) mean individual abundance/m2 and standard error of CF and SH according to stream width; and (d) relative composition (%) of FFG according to stream width.
Table 2. Classification of stream size focused on vertical (stream order) and lateral (stream width) gradients. A large number of samples (13,366) were used for classification of stream size based on distribution patterns of FFGs with the classification approach for streams and rivers of the EPA (Flotemersch et al. Citation2006).
Figure 4. Distribution patterns of FFGs along with altitude: (a) mean individual abundance and standard error of CF and SH and (b) relative composition (%) of FFG.
Table 3. Classifications of altitude focused on altitude. A large number of samples (13,366) were used for classification of altitude based on distribution patterns of FFGs with descriptors of the ecoregion of the WFD (WFD Citation2000).
Figure 5. Five stream types of South Korea focused on vertical, lateral, and altitude characteristics of streams using types of stream size and altitude. A large number of samples (13,366) were used for the classification of Korean stream types. Wadeable streams were divided into mountain, highland, and lowland wadeable streams. Non-wadeable streams were divided into lowland non-wadeable streams and rivers.
Figure 6. Distribution patterns of CF and SH along with stream types and clustering characteristics of stream types: (a) mean individual abundance/m2 and standard error of CF and SH according to stream types; and (b) dendrogram of five stream types based on mean individual abundance/m2 of benthic macroinvertebrates using the McQuitty's linkage and Sorensen's (Bray–Curtis) distance method (MO, mountain stream; HI, highland stream; LW, lowland wadeable stream; LN, lowland non-wadeable stream; RI, river).
Figure 7. Canonical correspondence analysis (CCA) multivariate ordination diagram relating 1,020 sampling sites to three physical environmental variables in South Korea. The plots present the ordination of sampling sites (a), and arrow length is proportional to relative importance (b) of the stream order, stream width, and altitude. W: wadeable stream, NW: non-wadeable stream.
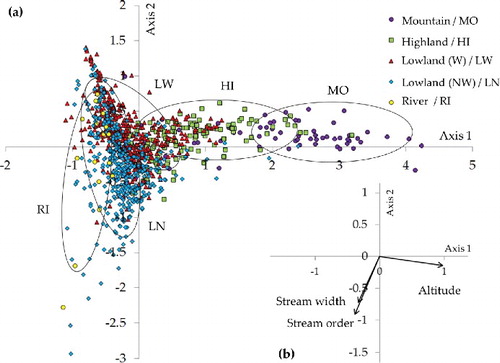
Table 4. Result of ordinations by canonical correspondence analysis (CCA) of data on 1020 sampling sites within a physical environmental (a) and Pearson correlation coefficients for the first three axes (b).
Table 5. Twenty-five indicator species (p < 0.05) sensitive to stream types, along with stream size and altitude in each stream type: (i) preference for mountain stream, (ii) preference for highland stream, (iii) preference for lowland wadeable stream, (iv) preference for lowland non-wadeable stream, and (v) preference for rivers. Monte Carlo randomization test results provided the proportion-based p-value indicating the statistical significance of the observed indicator value.