
Figures & data
Figure 1. Map of sampling sites for different areas influenced from human activities in the urban rivers of Pearl River Estuary.
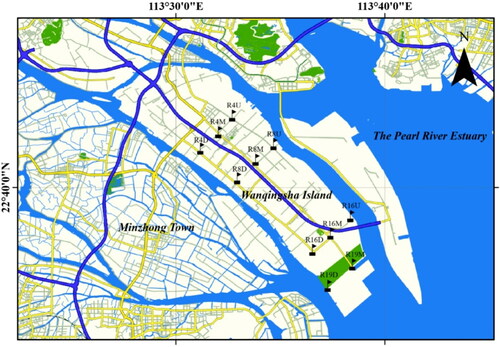
Figure 2. Contour plots of the six components identified from the complete EEM datasets by PARAFAC.
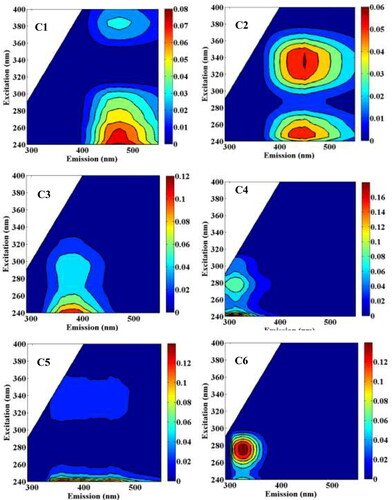
Table 1. Richness and abundance of bacteria and fungi estimated by diversity index.
Figure 3. Redundancy analysis (RDA) biplot of the distribution of (a) bacterial and (b) fungal communities on the phylum level with environmental variables in 4 different urban rivers.
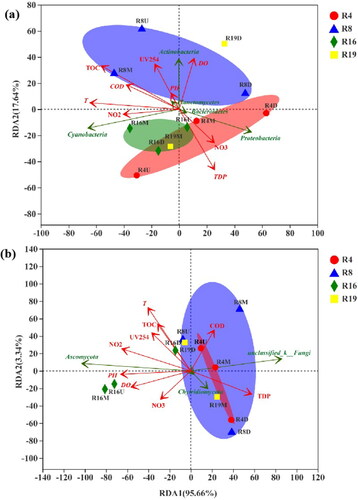
Figure 4. The community compositions of waterborne (a) bacteria and (b) fungi at the phylum level.
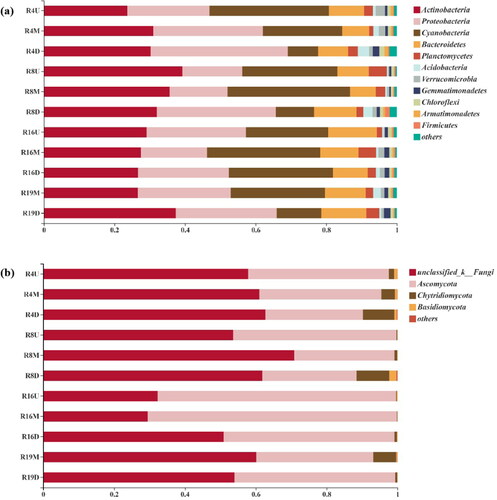
Figure 5. The community heatmap showing the normalized relative abundance of waterborne potential pathogens at the genus level.
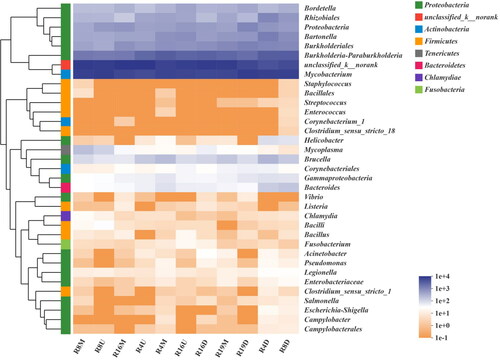
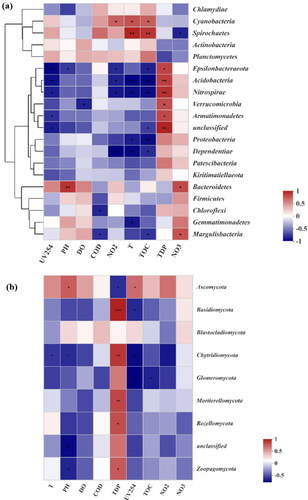
Figure 6. The Spearman correlation heatmap between physicochemical factors and the top 20 abundant bacteria (a) and the top 9 abundant fungi (b) at the phylum level. A single (*), double asterisks (**), treble asterisks (***) represent statistically significant differences at p values < 0.05, 0.01 and 0.001 with t-test, respectively.
Supplemental Material
Download MS Word (1.2 MB)Data availability statement
High-throughput sequencing raw data of bacteria and fungi were submitted to the NCBI Sequence Read Archive (SRA) database with accession number PRJNA664612.