Figures & data
Figure 1. Growth curve of S. obliquus under different P concentrations (Mean ± SE).
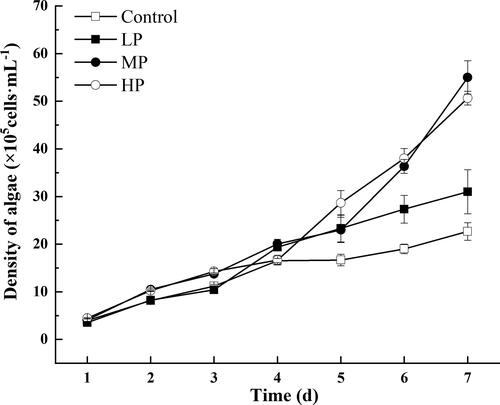
Table 1. The growth parameters of S. obliquus in different P concentration.
Figure 2. Element ratio (C:N, C:P and N:P) of algae under different P concentrations. Different capital indicated a significant difference in element ratio.
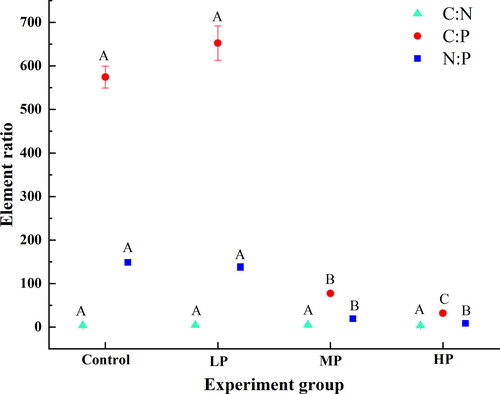
Figure 3. The grazing and filtration rates of rotifers fed with different quality algae (Mean ± SE). Different capital and lowercase indicated a significant difference among the treatments.
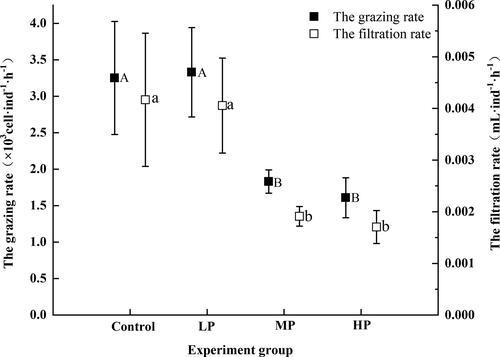
Figure 4. Life history parameters of rotifers in response to different algae quality (Mean ± SE). (I) Duration of productive period; (II) Duration of average lifespan, life expectancy at hatching and generation time; (III) offspring productions; (IV) Intrinsic rate of population increase. Different capitals indicated significant difference among treated food groups (p < 0.05).
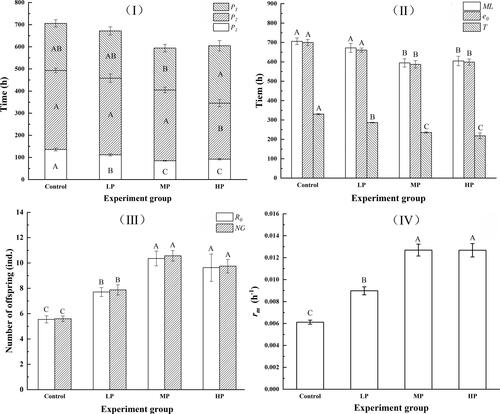
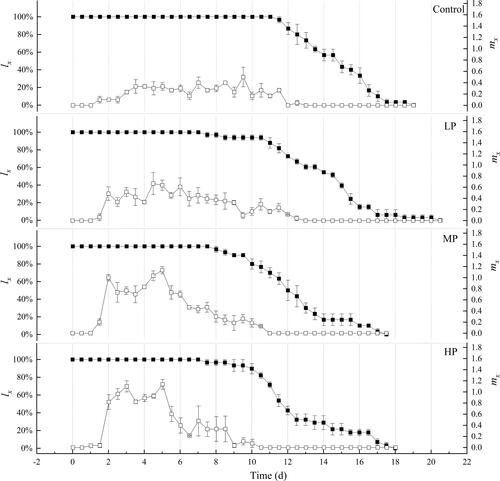
Figure 5. Age-specific survivorship (lx, filled square) and fecundity (mx, unfilled square) of R. rotatoria fed with different food quality of algae (Mean ± SE).