
Figures & data
Figure 1. The Vermilion River basin (Wabash River drainage), Illinois (highlighted in gray). Star indicates where the Bigeye Chub (Hybopsis amblops) reproductive study was conducted within the Salt Fork Vermilion River sub-basin in 2019 and 2021.
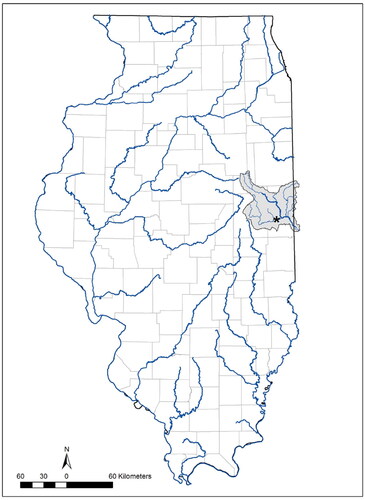
Figure 2. Dates sampling occurred for Hybopsis amblops in 2019 and 2021, with summaries of total spawning fish captured, water temperature (surface in 2019 and benthic in 2021), water depth (cm), and velocity (m/sec). Whiskers represent the 95% C.I., box represents 1 standard error, and dark horizontal line represents the mean values for the 10 transects.
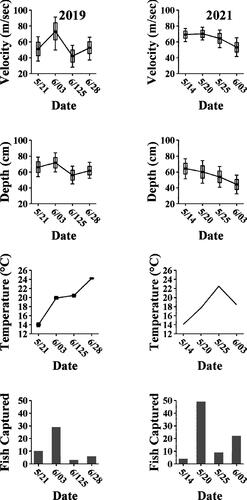
Table 1. Summary statistics for the covariates of numerical day of year (DOY), velocity (m/sec), depth (cm), and temperature (°C) for all Bigeye Chub (Hybopsis amblops) spawning surveys conducted within the Salt Fork Vermilion River sub-basin, Illinois, in 2019 and 2021 combined by dominant substrate (Sand or Gravel) and whether breeding individuals were observed.
Figure 3. Pearson correlation coefficients among sampling site water depth (cm), velocity (m/sec), day of year, and total spawning Bigeye Chub (Hybopsis amblops) captured in 2019 and 2021.
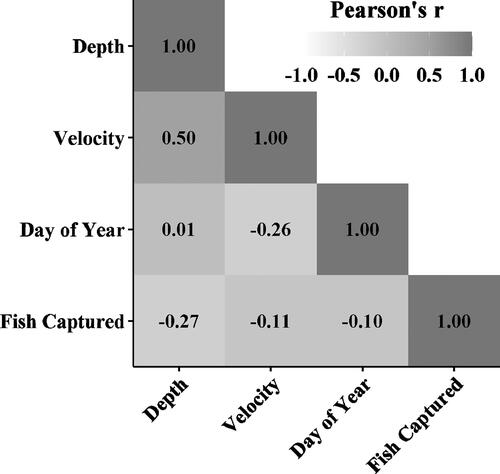
Figure 4. Bayesian conditional effects of dominant substrate, water velocity (m/sec), day of year, and water depth (cm) on the probability Bigeye Chub (Hybopsis amblops) breeding, with the gray bands representing the 95% Credible Intervals.
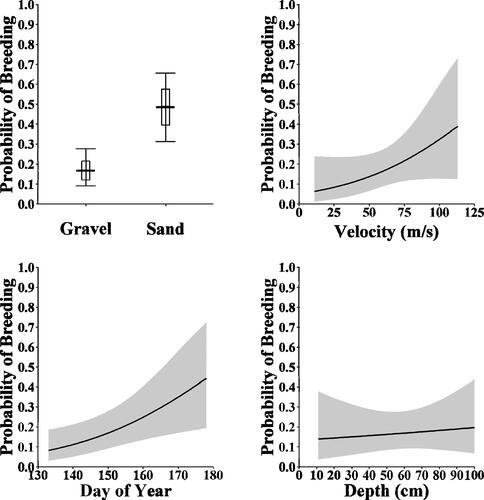
Table 2. Bayesian regression model parameter estimates, estimated error, 95% Credible Intervals, and bulk and tail estimated sample sizes for Bigeye Chub (Hybopsis amblops) spawning surveys conducted within the Salt Fork Vermilion River sub-basin, Illinois, in 2019 and 2021.
Supplemental Material
Download MS Word (393.8 KB)Data availability statement
The data that support the findings of this study are available from the corresponding author, JST, upon reasonable request.