
Figures & data
Figure 1. Study area within the San Luis National Wildlife Refuge (Merced County, California, USA) containing sites sampled during the 2022 pilot study and the 2023 main study. For the purposes of this map, sampled means visited for eDNA collection, trapping, or both.
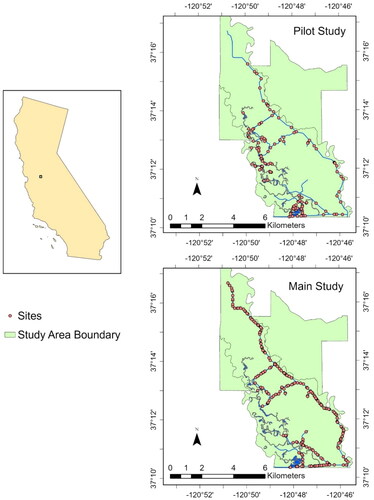
Table 1. Primer and probe sequences, optimal final concentrations, and annealing temperature for P. dabryanus + M. mizolepis (PD_MM) and M. anguillicaudatus (MA) assays.
Table 2. Species tested for cross-reactivity with the M. anguillicaudatus and P. dabryanus + M. mizolepis assays.
Table 3. Assay performance with tenfold serial dilutions of each target.
Figure 2. Box plot summarizing the distribution of total lengths (TLs) of loaches caught during the pilot study and the main study. Weeks 2, 4, and 6 of trapping were preceded by eDNA sampling during Weeks 1, 3, and 5. Weeks 7–8 comprised of only trapping using the remaining eDNA positive sites that were not trapped during week 6. One minnow trap per site was used during the pilot, while ten minnow traps per site were used for the main. The open circle points represent total length outliers. The bold black line in each box represents the median length and the whiskers extend 1.5 times the interquartile range.
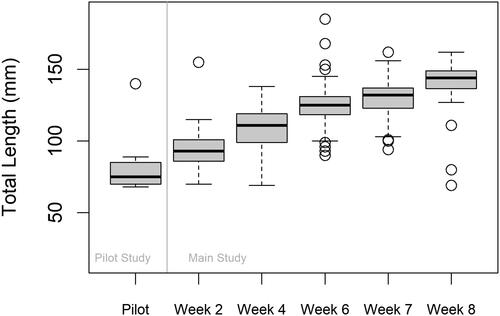
Table 4. The 2022 field effort for the pilot study.
Table 5. Sensitivity, specificity, and related rates comparing minnow traps (‘predictor’) to eDNA (‘truth’) for the pilot study.
Figure 3. Quantitative PCR detections of E. mordax (circle) and H. brasiliensis (square) within the small and large canal during initial sampling (a and b, respectively) and 24h after the removal of the proxy fishes from the small and large canal (c and d, respectively). Each point above 0 ng·μL−1 indicates that target eDNA was detected and represents a positive technical replicate.
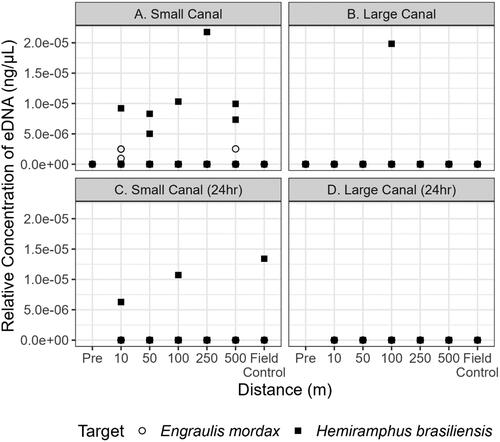
Figure 4. Quantitative PCR detections of P. dabryanus/M. mizolepis within the small and large canal during initial sampling (a and b, respectively) and 24h later within the small and large canal (c and d, respectively). Each point above 0 ng·μL−1 indicates that target eDNA was detected and represents a positive technical replicate.
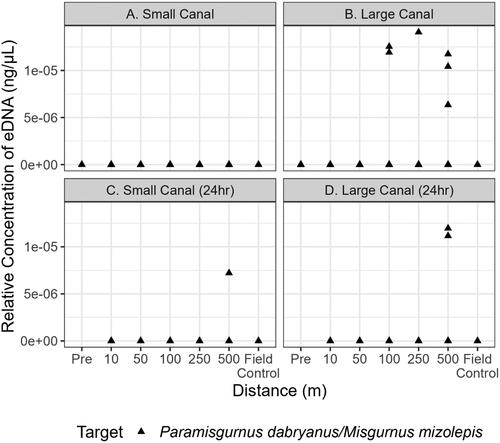
Figure 5. Artemis model output of the estimated effect size of target and distance on ln[eDNA] at the small canal location (Cq ∼ distance + target + (1|FilterID).
![Figure 5. Artemis model output of the estimated effect size of target and distance on ln[eDNA] at the small canal location (Cq ∼ distance + target + (1|FilterID).](/cms/asset/6e0b1acc-79dc-4811-9c1a-a508d865374f/tjfe_a_2378841_f0005_b.jpg)
Figure 6. Probability of detecting a small biomass (circle) and large biomass (square) in the small canal if it is present using the effect sizes of each variable as calculated by the model with three filter replicates. Points indicate mean probability of detection and bars indicate the 95% confidence intervals of that estimate.
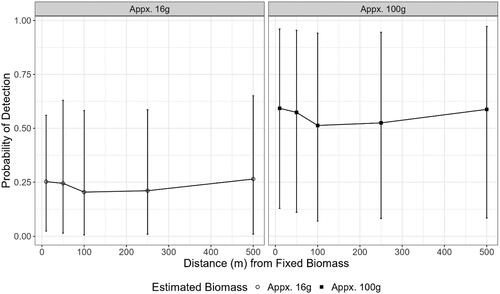
Table 6. The 2023 field effort for the main study.
Figure 7. Expected mean catch per minnow trap per day (24 h or 1440 min), as predicted by the best models for each study, considering both the count and zero portions of the hurdle models. Error bars indicate the 95% confidence intervals.
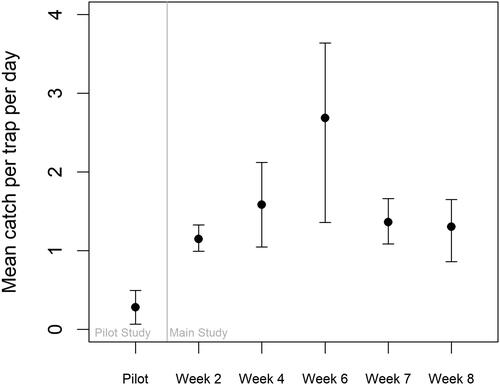
Table 7. Comparison of models for mean catch in the pilot study and the eDNA study.
Supplemental Material
Download MS Word (954.8 KB)Data availability statement
All data that supports the findings of this study are available in Dryad at https://doi.org/10.5061/dryad.n8pk0p342. Statistical code is available at https://github.com/USFWS/LFWO-Loach-eDNA.