1,555
Views
10
CrossRef citations to date
0
Altmetric
Cornea and Ocular Surface

Evaluation of the Ocular Surface Disease Index Questionnaire as a Discriminative Test for Clinical Findings in Dry Eye Disease Patients

ORCID Icon, , , , , , , , & show all
Pages 941-947 | Received 13 Dec 2018, Accepted 31 Mar 2019, Published online: 29 Apr 2019

Figures & data

Figure 1. Subjects demographics: Bar graph showing the age and gender distribution among 1090 subjects tested for dry eye disease.

Figure 1. Subjects demographics: Bar graph showing the age and gender distribution among 1090 subjects tested for dry eye disease.

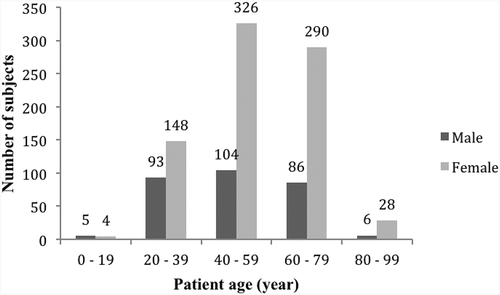
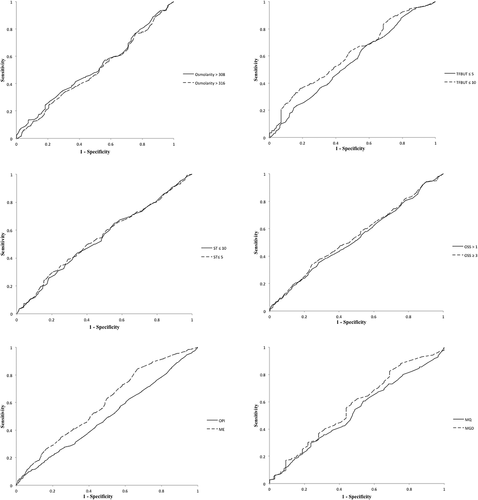
Table 1. Summary of ROC curve parameters and distribution of clinical tests.

Figure 2. ROC curve is displayed to determine the optimum balanced sensitivity and specificity of OSDI to predict pathological osmolarity, TFBUT, OPI, ST, OSS, ME, MQ and MGD. Abbreviations: tear film break-up time (TFBUT), ocular protection index (OPI), Schirmer I test (ST), ocular surface staining (OSS, Oxford Grading Scheme), meibum expressibility (ME), meibum quality (MQ), meibomian gland disease (MGD).

Figure 2. ROC curve is displayed to determine the optimum balanced sensitivity and specificity of OSDI to predict pathological osmolarity, TFBUT, OPI, ST, OSS, ME, MQ and MGD. Abbreviations: tear film break-up time (TFBUT), ocular protection index (OPI), Schirmer I test (ST), ocular surface staining (OSS, Oxford Grading Scheme), meibum expressibility (ME), meibum quality (MQ), meibomian gland disease (MGD).