Figures & data
FIG. 1 Nasal cavity models of different mesh resolutions, 82,000, 286,000, 586,000 and 822,000 cells.
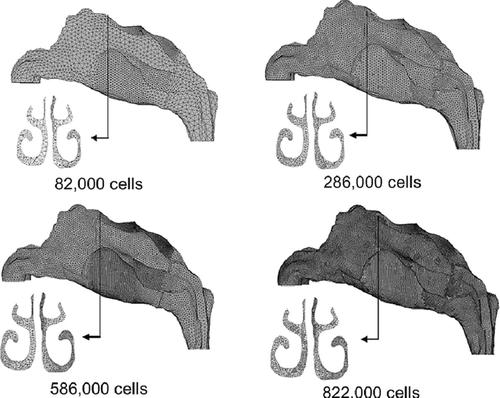
FIG. 2 Velocity profiles of a coronal section near the nasal valve region for the four different nasal cavity models. The profile is taken along the line shown on the coronal section.
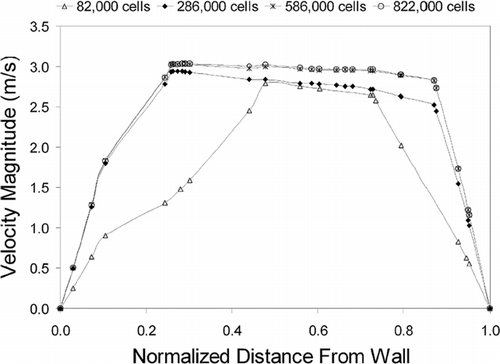
FIG. 3 Deposition efficiency for monodisperse particles released passively from the nostril inlet subjected to airflow rates of 20 L/min, 30 L/min and 40 L/min using a hybrid tracking technique.
FIG. 4 (A) A velocity vector field in the horizontal plane for inlet flowrate of 20 L/min. A region of recirculation is found near the roof of the nasal cavity. The normalised distance spans from the average center of the two nostril openings in the x-axis, to the nasopharynx where the two cavities have joined completely. (B) Velocity contours at different cross-sections through the cavity. The cross-sections correspond to the normalised distance from the nasal inlet. (C) Area averaged velocity profile inside the nasal passage. Maximum averaged area occurs around 0.10–0.15, near the nasal valve region. An increase in the velocity occurs at the nasopharynx region where the cross-sectional area decreases.
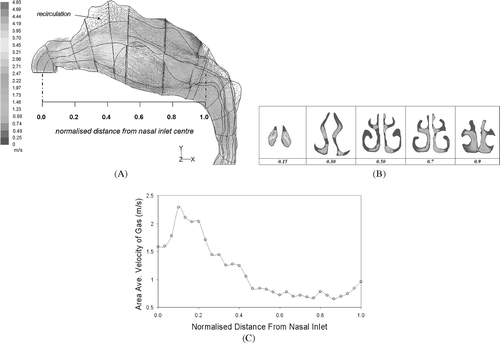
FIG. 5 (A) The anterior third of the nasal cavity that has been split into three zones for investigation. Zone 1 consists of the nostril inlet surface, zone 2 includes the nasal valve region and zone 3 is the beginning of the main nasal airway-the turbinate region. (B) Total deposition in zone 1 and zone 2 of the nasal cavity for different particle injection velocity. Particles were uniformly released from the nostril inlet surface, in the normal direction at different injected particle velocities, u*. Where u* = u pi /u g .
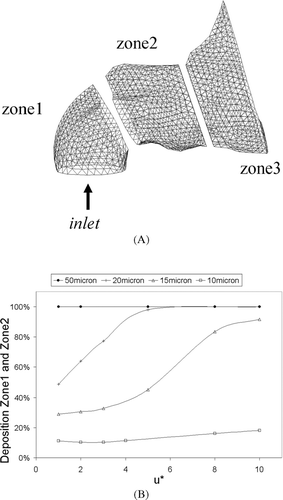
FIG. 6 (A) Deposition patterns for 10 μ m particles released uniformly from the inlet surface normal to the nostril openings at u* = 1 and u* = 10. (B) Deposition patterns for 15 μm particles released uniformly from the inlet surface normal to the nostril openings at u* = 1 and u* = 10. (C) Deposition patterns for 50 μm particles released uniformly from the inlet surface normal to the nostril openings at u* = 1 and u* = 10.
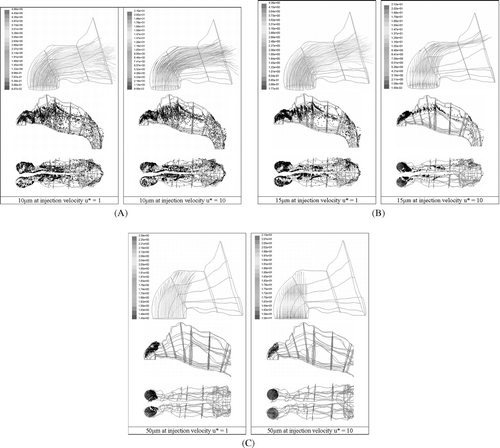
FIG. 7 Deposition in zone 1 and zone 2 for monodispersed particles released uniformly from the inlet surface at 10 m/s for different insertion angles. The insertion angle begins at 0° degrees for a horizontal direction aimed towards the nasal valve region and increasing through a counter-clockwise direction in the x-y axis (see ).
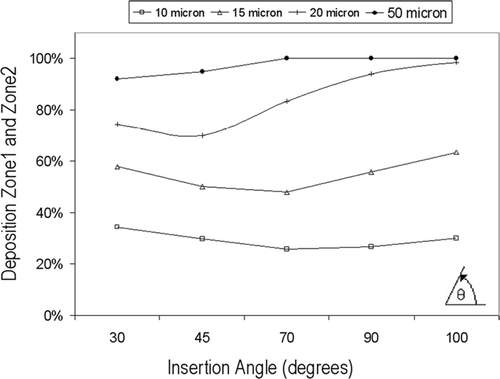
FIG. 8 (A) Deposition patterns for 15 μm particles released uniformly from the inlet surface uniformly from the inlet surface at insertion angles 100° and 90°. (B) Deposition patterns for 15 μm particles released uniformly from the inlet surface uniformly from the inlet surface at insertion angles 70° and 30°.
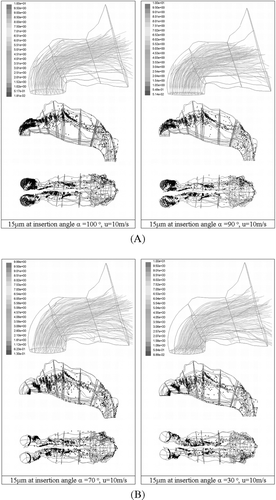
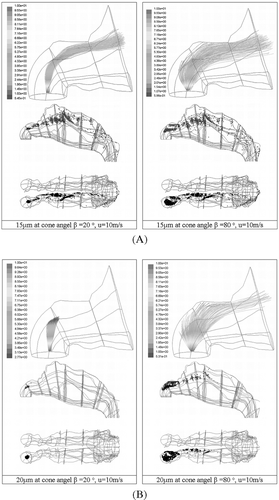
FIG. 9 Total deposition in zone 1 and zone 2 for monodispersed particles released at 10 m/s from a small internal diameter at the center of the nostril inlet surface. The spray cone angles ranged from 20° and 80°.
FIG. 10 (A) Deposition patterns for 15 μm particles released at 10 m/s from a small internal diameter at the center of the nostril inlet surface. The spray cone angles ranged from 20° and 80°. (B) Deposition patterns for 20 μm particles released at 10 m/s from a small internal diameter at the center of the nostril inlet surface. The spray cone angles ranged from 20° and 80°.