3,019
Views
80
CrossRef citations to date
0
Altmetric
Original Articles

Numerical Simulations of Capillary Aerosol Generation: CFD Model Development and Comparisons with Experimental Data

, , &
Pages 952-973 | Received 21 Feb 2007, Accepted 01 Aug 2007, Published online: 10 Sep 2007

Figures & data

FIG. 1 Inlet conditions for the CAG system including (1) co-flow air, (2) the capillary nozzle, and (3) downstream particle size distribution.
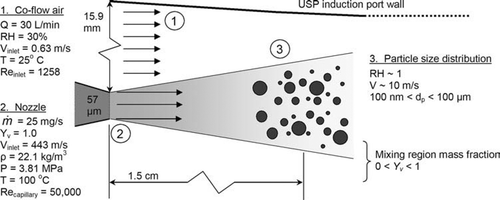
FIG. 1 Inlet conditions for the CAG system including (1) co-flow air, (2) the capillary nozzle, and (3) downstream particle size distribution.

FIG. 2 Exterior and interior surfaces of the sectioned USP induction port geometry with (a) dimensions and (b) offsets used for assembly.
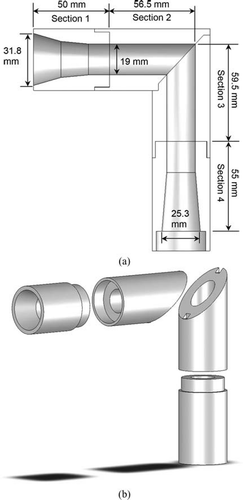
FIG. 2 Exterior and interior surfaces of the sectioned USP induction port geometry with (a) dimensions and (b) offsets used for assembly.

FIG. 3 Computational geometry of the USP induction port internal surface with expanded inlet and outlet sections to approximate experimental conditions. The expanded inlet section was used to represent exposure to an open environment. The expanded outlet section was used to approximate downstream conditions.
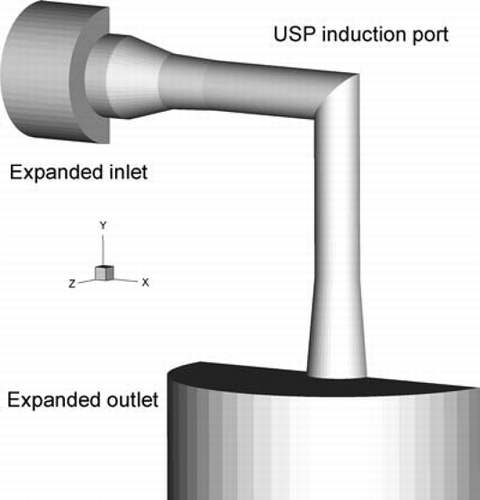
FIG. 3 Computational geometry of the USP induction port internal surface with expanded inlet and outlet sections to approximate experimental conditions. The expanded inlet section was used to represent exposure to an open environment. The expanded outlet section was used to approximate downstream conditions.

TABLE 1 User-defined functions (UDF) and codes required to simulate the transport and deposition of capillary-generated aerosols.

FIG. 4 Multiblock structured computational mesh near the 57 μ m capillary tip. The USP inlet diameter is 31.8 mm, resulting in a three order of magnitude change in spatial dimensions that must be resolved.
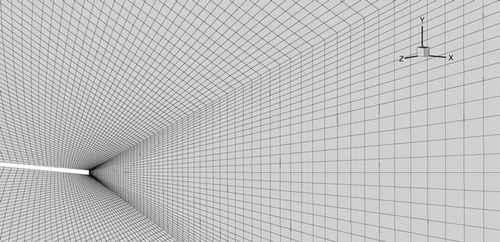
FIG. 4 Multiblock structured computational mesh near the 57 μ m capillary tip. The USP inlet diameter is 31.8 mm, resulting in a three order of magnitude change in spatial dimensions that must be resolved.

FIG. 5 Continuous gas phase variables at the midplane and near the capillary tip including (a) velocity magnitude with instantaneous streamlines and (b) temperature after 2 s for 30 L/min of co-flow air.
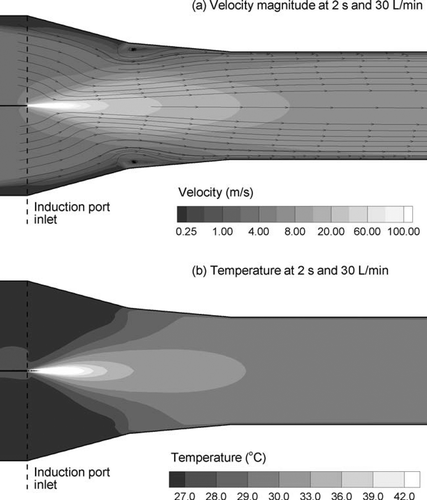
FIG. 5 Continuous gas phase variables at the midplane and near the capillary tip including (a) velocity magnitude with instantaneous streamlines and (b) temperature after 2 s for 30 L/min of co-flow air.

FIG. 6 Contours of velocity magnitude and velocity vectors at the midplane and selected cross-sectional slice locations for (a) 0.5 s and (b) 1.0 s after the capillary was turned on. Highly vortical flow was observed downstream of the capillary tip at 0.5 s due to the sudden increase in momentum associated with start-up. At 1 s, the flow was more evenly distributed. Velocity conditions remain relatively constant after 1 s.
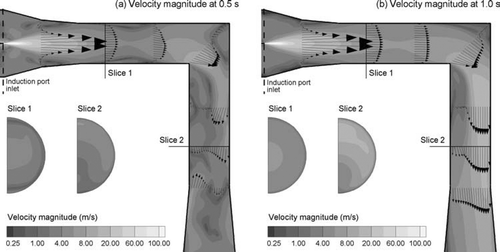
FIG. 6 Contours of velocity magnitude and velocity vectors at the midplane and selected cross-sectional slice locations for (a) 0.5 s and (b) 1.0 s after the capillary was turned on. Highly vortical flow was observed downstream of the capillary tip at 0.5 s due to the sudden increase in momentum associated with start-up. At 1 s, the flow was more evenly distributed. Velocity conditions remain relatively constant after 1 s.

FIG. 7 Relative humidity values at the midplane and selected cross-sectional slice locations at (a) 0.5, (b) 1.0, (c) 1.5, and (d) 2.0 s. Values in the downstream section increased from an initial value of 30% to approximately 80–90% after 2 s.
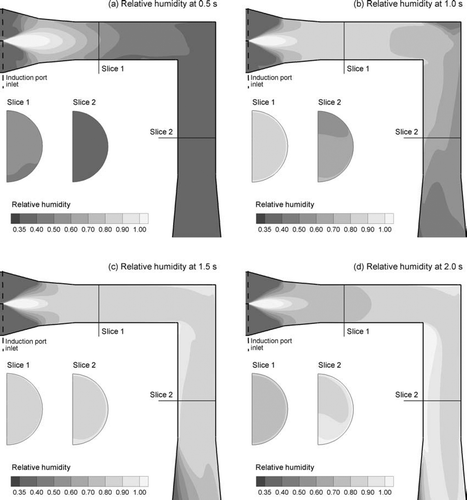
FIG. 7 Relative humidity values at the midplane and selected cross-sectional slice locations at (a) 0.5, (b) 1.0, (c) 1.5, and (d) 2.0 s. Values in the downstream section increased from an initial value of 30% to approximately 80–90% after 2 s.

FIG. 8 Angle of the capillary jet based on a relative humidity value of 1.0 initiated at the capillary tip under 30 L/min co-flow conditions. The computed angle of 29° was similar to the CAG experimental study of CitationShen et al. (2004).
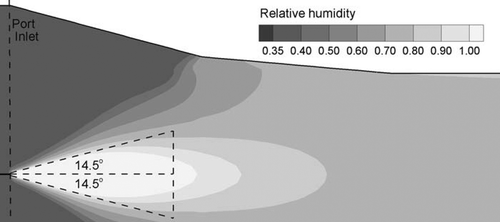
FIG. 8 Angle of the capillary jet based on a relative humidity value of 1.0 initiated at the capillary tip under 30 L/min co-flow conditions. The computed angle of 29° was similar to the CAG experimental study of CitationShen et al. (2004).

FIG. 9 Initial particle size distribution based on mass fraction measured approximately 1.5 cm away from the capillary tip using laser diffraction. Histogram blocks are shown separated for clarity.
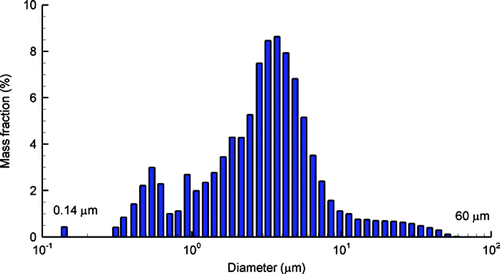
FIG. 9 Initial particle size distribution based on mass fraction measured approximately 1.5 cm away from the capillary tip using laser diffraction. Histogram blocks are shown separated for clarity.

FIG. 10 Trajectories and diameters for sample droplets released from the capillary tip after 1 s grouped by initial droplet size range: (a) 0.1–1 μ m, (b) 1–5 μ m, (c) 5–10 μ m, and (d) greater than 10μ m.
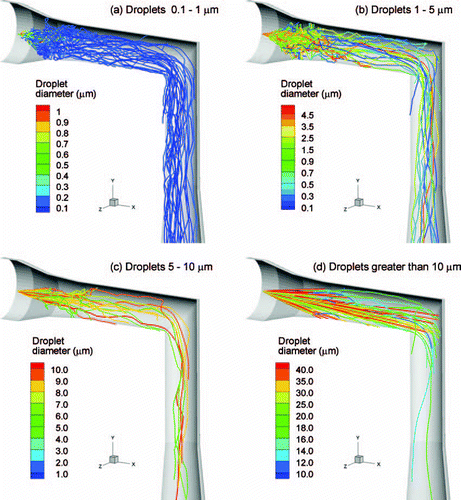
FIG. 10 Trajectories and diameters for sample droplets released from the capillary tip after 1 s grouped by initial droplet size range: (a) 0.1–1 μ m, (b) 1–5 μ m, (c) 5–10 μ m, and (d) greater than 10μ m.

TABLE 2 Sectional induction port drug mass deposition values (%) for particles and droplets

FIG. 11 Sectioned deposition results of a transient polydisperse aerosol released over 2 s from the capillary tip for (a) non-evaporating particles, and (b) evaporating droplets. The reported CFD mass fractions are based on the original mass of drug estimated to be in the droplets.
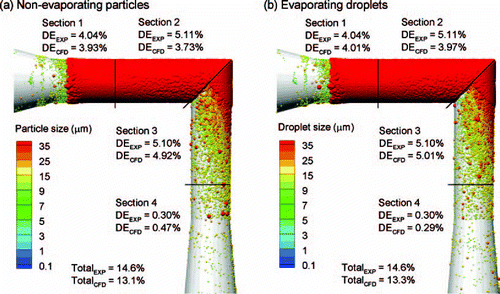
FIG. 11 Sectioned deposition results of a transient polydisperse aerosol released over 2 s from the capillary tip for (a) non-evaporating particles, and (b) evaporating droplets. The reported CFD mass fractions are based on the original mass of drug estimated to be in the droplets.

FIG. 12 Distribution of deposited mass fraction based on final droplet size. A majority of the deposited mass results from particles that are either 1 μ m and below or greater than approximately 5 μ m.
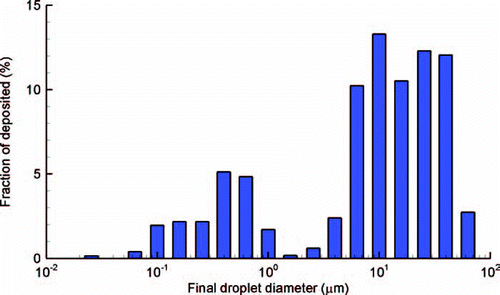
FIG. 12 Distribution of deposited mass fraction based on final droplet size. A majority of the deposited mass results from particles that are either 1 μ m and below or greater than approximately 5 μ m.

FIG. 13 Mass fraction distribution of droplets exiting the USP induction port based on measurements made in the Next Generation Impactor (NGI) and CFD simulation with and without evaporation.
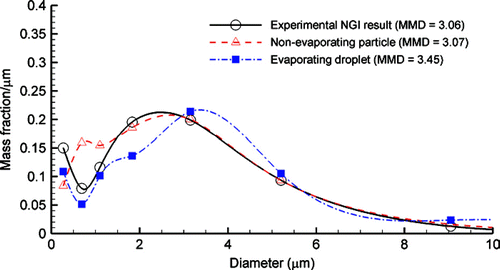
FIG. 13 Mass fraction distribution of droplets exiting the USP induction port based on measurements made in the Next Generation Impactor (NGI) and CFD simulation with and without evaporation.

Reprints and Corporate Permissions

Please note: Selecting permissions does not provide access to the full text of the article, please see our help page How do I view content?

To request a reprint or corporate permissions for this article, please click on the relevant link below:

Academic Permissions

Please note: Selecting permissions does not provide access to the full text of the article, please see our help page How do I view content?

Obtain permissions instantly via Rightslink by clicking on the button below:

If you are unable to obtain permissions via Rightslink, please complete and submit this Permissions form. For more information, please visit our Permissions help page.