Figures & data
TABLE 1 Test conditions for the discrete and continuous-phase particle tracking simulations
FIG. 1 Computational nasal-laryngeal airway model: (a) medical image based surface model and (b) ICEM-generated computational mesh composed of approximately two million unstructured tetrahedral elements and a very fine near-wall pentahedral grid. The nasopharynx is divided into two passages by the uvula. The forward protruding angle formed by the epiglottis as well as the pharyngeal sinuses on both sides of the lower pharynx were retained in the current airway geometry.
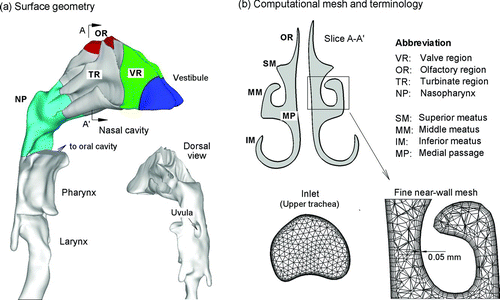
FIG. 2 Dimensions of the left and right nasal passages as a function of the distance from the nose tip based on coronal cross-sectional area and hydraulic diameter, Dh . The nasal value is marked with an arrow for the left and right passages.
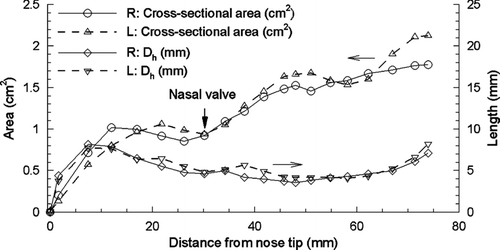
FIG. 3 Velocity fields in the nasal-laryngeal airway at an exhalation flow rate of 20 L/min in three-dimensional and cross-sectional (coronal) views. The secondary motions within the nasal valves and middle turbinate region are also presented.
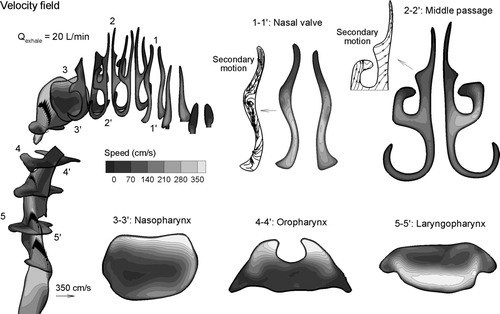
FIG. 4 Iso-surfaces of the turbulent viscosity ratio, ζ= (ν+ν T )/ν, in the nasal-laryngeal airway at an exhalation flow rate of 20 L/min with (a) ζ= 2, and (b) ζ= 11.
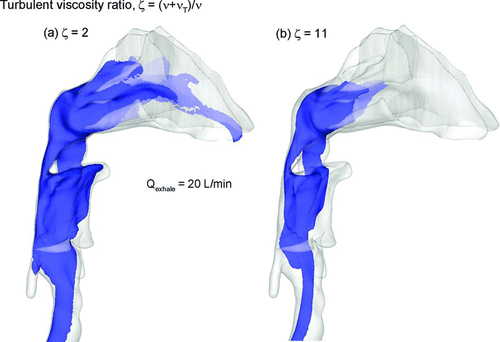
FIG. 5 Particle dynamics illustrated by (a) streamtraces of six fluid elements initiated at the upper trachea, and (b) snapshots of particle locations inside the nasal-laryngeal airway at different instants and a constant exhalation rate of 20 L/min. Three thousand discrete particles of 400 nm diameter were released at t = 0 s and tracked in the particle history illustration.
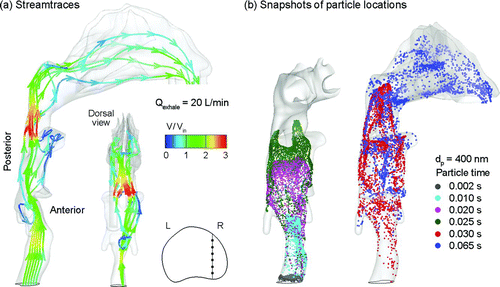
FIG. 6 Comparison of particle deposition fractions as a function of particle diameter based on the DF-VC and Lagrangian modeling approaches as well as existing in vitro experiments at an exhalation flow rate of (a) 10 L/min and (b) 20 L/min.
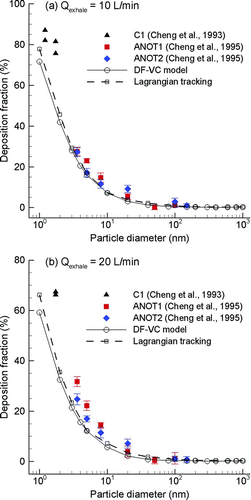
TABLE 2 Comparison of in vitro and in vivo experiments with the nasal-laryngeal geometry
FIG. 7 Comparison of the deposition fraction predicted by the DF-VC model with diffusional parameters based on existing (a) in vitro (D 0.5 Q −0.125) and (b) in vivo (D 0.5 Q −0.28) studies. Inclusion of the Cunningham correction factor (Cc ) improves agreement between the correlation and numerical data (b). Results of the DF-VC model and Lagragian particle tracking are compared with existing in vitro and in vivo deposition data for particles less than 150 nm as a function of (c) the in vivo diffusion parameter and (d) the diffusion parameter suggested by CitationCheng et al. (1996b). In general, deposition results from both the DF-VC and Lagrangian models match the experimental data. Units: Q [L/min] and D [cm2/s].
![FIG. 7 Comparison of the deposition fraction predicted by the DF-VC model with diffusional parameters based on existing (a) in vitro (D 0.5 Q −0.125) and (b) in vivo (D 0.5 Q −0.28) studies. Inclusion of the Cunningham correction factor (Cc ) improves agreement between the correlation and numerical data (b). Results of the DF-VC model and Lagragian particle tracking are compared with existing in vitro and in vivo deposition data for particles less than 150 nm as a function of (c) the in vivo diffusion parameter and (d) the diffusion parameter suggested by CitationCheng et al. (1996b). In general, deposition results from both the DF-VC and Lagrangian models match the experimental data. Units: Q [L/min] and D [cm2/s].](/cms/asset/af61fbb2-9ab5-4449-9091-34b99872be34/uast_a_395260_o_f0007g.jpg)
FIG. 8 Comparison of numerically determined deposition fractions as a function of Stokes number, St k , for the DF-VC, Lagrangian, and CS models. Deviations in deposition fractions between the models that account for inertia (DF-VC and Lagrangian) and the chemical species (CS) approach occurs around Stk = 1.0 × 10⁻⁵ and indicates the onset of particle impaction.
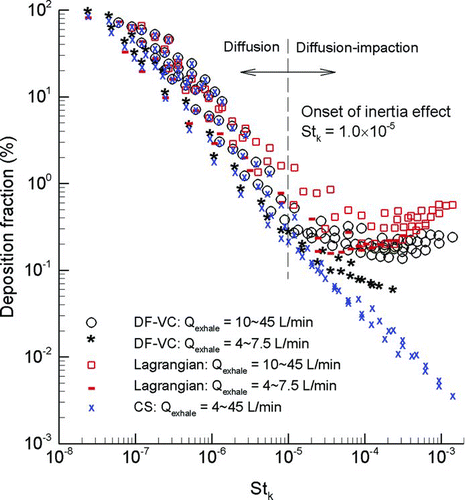
FIG. 9 Inertia-based deposition fraction as a function of (a) the conventional impaction parameter (d 2 p Q), versus (b) a new inertial parameter (d 0.2 p Q) for particles ranging from 1 to 1000 nm and exhalation flow rates ranging from 4 to 45 L/min.
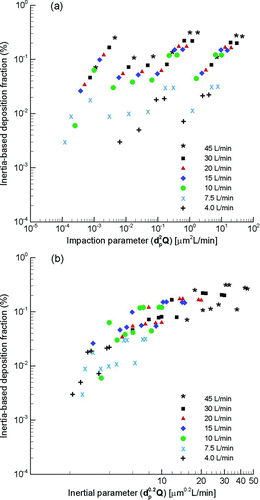
FIG. 10 Deposition fraction as a function of the new composite deposition parameter over a range of flow rate and particle conditions.
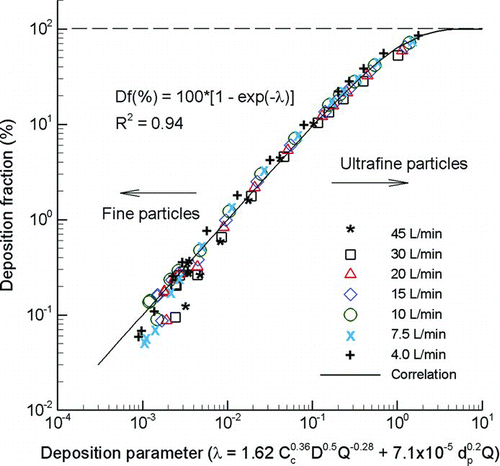
FIG. 11 Deposition enhancement factors (DEF) based on the DF-VC model for different particle sizes at an exhalation flow rate of 20 L/min: (a) 40 nm, (b) 100 nm, (c) 400 nm, and (d) 1,000 nm.
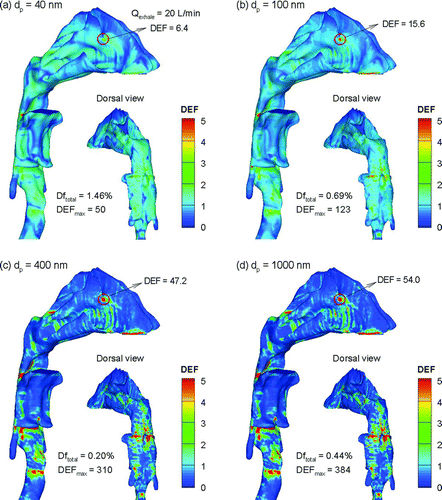
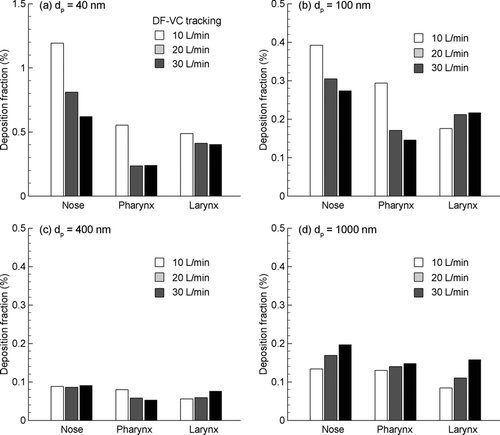
FIG. 12 Regional partitioning of deposition fractions between the nose, pharynx, and larynx under three expiratory conditions (10, 20, and 30 L/min) for different particle sizes: (a) 40 nm, (b) 100 nm, (c) 400 nm, and (d) 1,000 nm.