Figures & data
FIG. 1 Schematic diagram of the instrument designed to measure the polarization and directionality of thermal emission and scattering by individual particles in airflow. Aerosol flow intersects with the laser beam at right angles. The actual direction of the inlet aerosol jet nozzle is perpendicular to the page. Other elements of the instrument, including the nozzle outlet, laser crystal, cavity mirrors, flow control system, and data acquisition system, are not shown.
FIG. 2 The Cartesian and polar coordinate systems defined for the development of a theoretical model. The origin of coordinate system O is the center of the detection volume. The intracavity laser beam and nozzle inlet are parallel to the z- and x-axes, respectively. The laser beam propagates in the +z and −z directions. The y–z plane includes the optical axes of the four objective lenses.
Table 1 Definitions of the NDPs used for data analysis
Table 2 Properties of the carbon particles used in the experiments
FIG. 3 Typical waveforms of the scattering signals for 294 nm PSL particles: (a) single spheres (singlets) classified by the APM at 14.6 fg and (b) two-sphere clusters (doublets) classified by the APM at 29.2 fg.
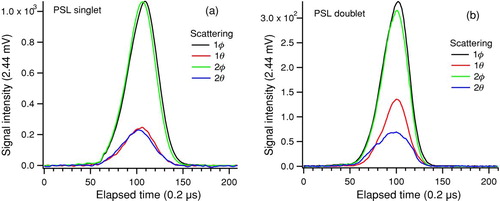
FIG. 4 Typical waveforms of the Aqua-Black and Aquadag particles classified by the APM at 14.6 fg: (a) scattering signals of Aqua-Black, (b) scattering signals of Aquadag, (c) thermal emission signals of Aqua-Black, and (d) thermal emission signals of Aquadag. The waveforms of identical particles are shown for the scattering and thermal emission signals and their horizontal axes are common.
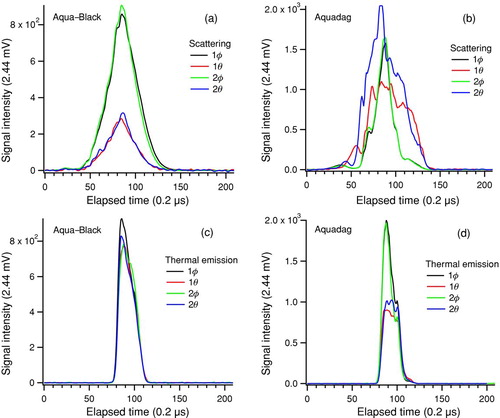
FIG. 5 Occurrence distributions of (a) S1CP and (b) T1CP for approximately 5000 measured particles in each sample. For spherical particles, S1CP and T1CP are equal to zero by definition.
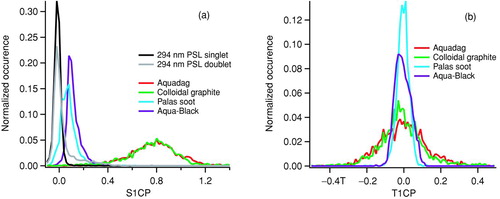
FIG. 6 Measured correlations among S1CP, S2CP, and SDR for doublet particles of 294 nm PSL. Filled circles indicate the measured data for individual particles. The number of measured particles is approximately 5000. Filled squares indicate the model calculations for Rayleigh spheroids with q = 0.1 (needle-like), which are also shown in Figure S4.
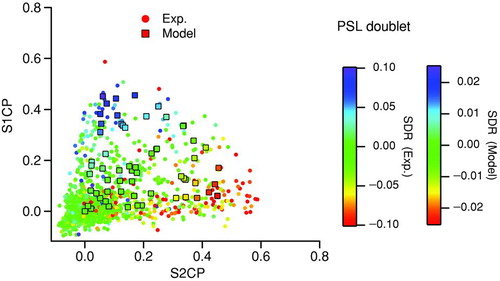
FIG. 7 Measured correlations among (a) S1CP, S2CP, and SDR; (b) S1CP, T1CP, and T2CP; and (c) S2CP, T2CP, and T1CP for Aquadag particles with 14.6 fg mass. Filled circles indicate the measured data for individual particles. The number of measured particles is approximately 5000. Filled squares indicate the model calculations for Rayleigh spheroids with q = 10 (plate-like), which are also shown in Figure S7.
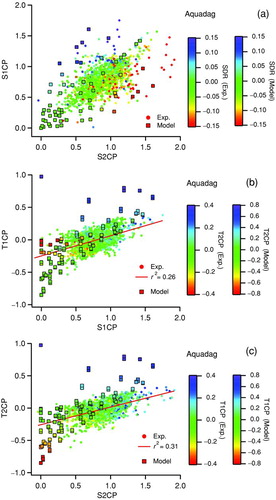
FIG. 8 Measured correlations among (a) S1CP, S2CP, and SDR; (b) S1CP, T1CP, and T2CP; and (c) S2CP, T2CP, and T1CP for colloidal graphite particles with 14.6 fg mass. Filled circles indicate the measured data for individual particles. The number of measured particles is approximately 5000. Filled squares indicate the model calculations for Rayleigh spheroids with q = 10 (plate-like), which are also shown in Figure S7.
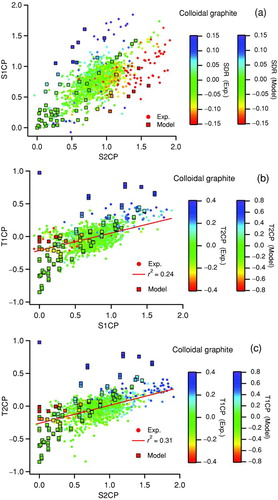
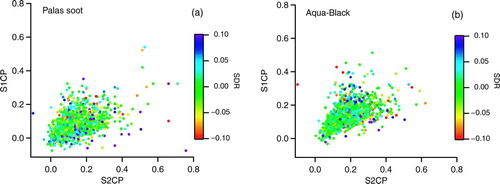
FIG. 9 Measured correlations among S1CP, S2CP, and SDR for (a) Palas soot and (b) Aqua-Black. The number of measured particles is approximately 5000 for each sample.