2,449
Views
33
CrossRef citations to date
0
Altmetric
Original Articles

Facile Method for Determining the Aspect Ratios of Mineral Dust Aerosol by Electron Microscopy

&
Pages 715-724 | Received 19 Feb 2014, Accepted 23 Apr 2014, Published online: 25 Jun 2014

Figures & data

TABLE 1 Average aspect ratios and standard deviations for the minerals used in this study for both the top-down and side-on orientations

FIG. 1. (a) A representative scanning electron microscopy (SEM) image of the calcite particles in the top-down orientation. (b) A representative SEM image of the calcite particles in the side-on orientation, imaged at an angle of 5˚ from normal. (c) The distribution of calcite aspect ratios obtained from SEM images. The fraction of particles by number is plotted vs. aspect ratio. (d) SEM images of quartz particles in the top-down orientation and the (e) side-on orientation. (f) The distribution of quartz aspect ratios obtained from the SEM images. The tick marks label the bin to the left of the number, making the aspect ratio of the first bin 1.0.
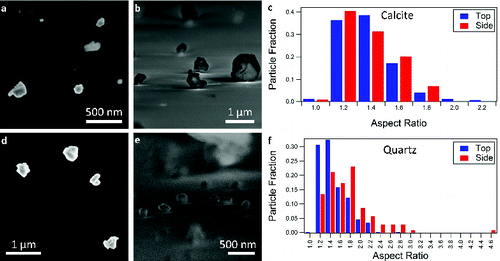
FIG. 1. (a) A representative scanning electron microscopy (SEM) image of the calcite particles in the top-down orientation. (b) A representative SEM image of the calcite particles in the side-on orientation, imaged at an angle of 5˚ from normal. (c) The distribution of calcite aspect ratios obtained from SEM images. The fraction of particles by number is plotted vs. aspect ratio. (d) SEM images of quartz particles in the top-down orientation and the (e) side-on orientation. (f) The distribution of quartz aspect ratios obtained from the SEM images. The tick marks label the bin to the left of the number, making the aspect ratio of the first bin 1.0.

FIG. 2. SEM images of KGa-1b (kaolinite) in the (a) top-down and (b) side-on orientations. (c) The distribution of aspect ratios determined for KGa-1b in the two orientations. (d) SEM images of KGa-2 (kaolinite) in the top-down and (e) side-on orientations. (f) The distribution of aspect ratios for KGa-2. The tick marks in (c) and (f) denote the bin to the left of the number.
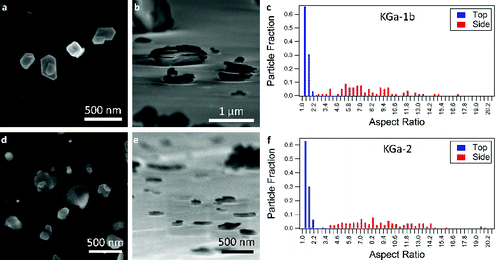
FIG. 2. SEM images of KGa-1b (kaolinite) in the (a) top-down and (b) side-on orientations. (c) The distribution of aspect ratios determined for KGa-1b in the two orientations. (d) SEM images of KGa-2 (kaolinite) in the top-down and (e) side-on orientations. (f) The distribution of aspect ratios for KGa-2. The tick marks in (c) and (f) denote the bin to the left of the number.

FIG. 3. SEM images of NX-illite in the (a) top-down and (b) side-on orientations. (c) The distribution of aspect ratios determined for NX-illite from the SEM images. (d) SEM images of STx-1b (montmorillonite) in the top-down and (e) side-on orientations. (f) The measured distribution of aspect ratios for STx-1b. (g) SEM images of SWy-2 in the top-down and (h) side-on orientations. (i) The distribution of aspect ratios for SWy-2. For (c), (f), and (i), the tick marks denote the bin to the left of the number.
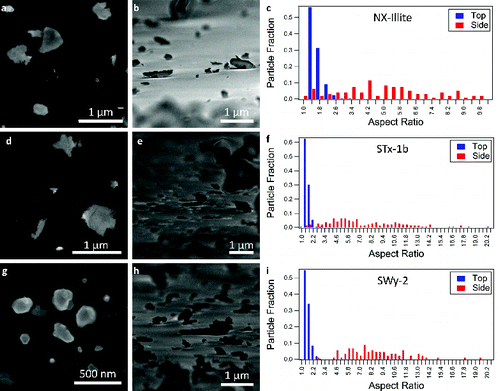
FIG. 3. SEM images of NX-illite in the (a) top-down and (b) side-on orientations. (c) The distribution of aspect ratios determined for NX-illite from the SEM images. (d) SEM images of STx-1b (montmorillonite) in the top-down and (e) side-on orientations. (f) The measured distribution of aspect ratios for STx-1b. (g) SEM images of SWy-2 in the top-down and (h) side-on orientations. (i) The distribution of aspect ratios for SWy-2. For (c), (f), and (i), the tick marks denote the bin to the left of the number.

FIG. 4. Comparison of the aspect ratios for each species studied. For each type of mineral, the aspect ratios observed for the top-down and side-on orientations are shown. In the box and whiskers plots, the center line is the average of the data, the bottom of the box is the 25th percentile, the top of the box is the 75th percentile, and the whiskers correspond to the 5th and 95th percentiles.
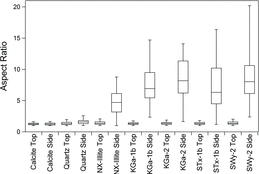
FIG. 4. Comparison of the aspect ratios for each species studied. For each type of mineral, the aspect ratios observed for the top-down and side-on orientations are shown. In the box and whiskers plots, the center line is the average of the data, the bottom of the box is the 25th percentile, the top of the box is the 75th percentile, and the whiskers correspond to the 5th and 95th percentiles.

TABLE 2 Comparison of measured average aspect ratios to literature values for the clay minerals. The NX-illite is compared to measurements of illite

TABLE 3 Specific surface area (SSA) measurements using SEM, BET, and AFM. The SSA calculations from the SEM measurements are performed assuming the particles are hexagonal prisms, rectangular prisms, and spheroids. NX-Illite is compared to BET measurements of illite

Supplemental material

2014_Veghte_aspect_ratio_AST_SI.zip

Download Zip (261.5 KB)

Reprints and Corporate Permissions

Please note: Selecting permissions does not provide access to the full text of the article, please see our help page How do I view content?

To request a reprint or corporate permissions for this article, please click on the relevant link below:

Academic Permissions

Please note: Selecting permissions does not provide access to the full text of the article, please see our help page How do I view content?

Obtain permissions instantly via Rightslink by clicking on the button below:

If you are unable to obtain permissions via Rightslink, please complete and submit this Permissions form. For more information, please visit our Permissions help page.