878
Views
16
CrossRef citations to date
0
Altmetric
Original Articles

Physicochemical Characterization of Simulated Welding Fumes from a Spark Discharge System

, , , , , & show all
Pages 768-776 | Received 09 Feb 2014, Accepted 03 May 2014, Published online: 25 Jun 2014

Figures & data

TABLE 1 Elemental and compositional specification of test electrodes (Hobart Citation2008)

FIG. 1. Experimental setup. Sampling ports #1 and #2 are located before and after the coagulation chamber, respectively.
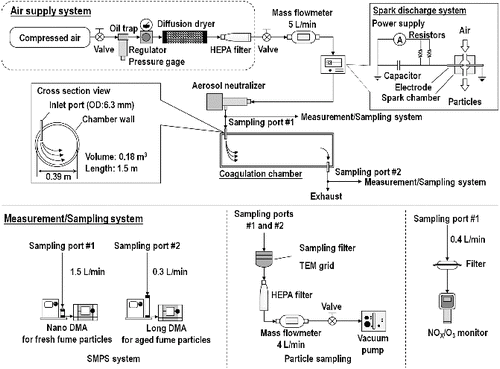
FIG. 1. Experimental setup. Sampling ports #1 and #2 are located before and after the coagulation chamber, respectively.

TABLE 2 Sample current and particle characteristics (size, total number concentration, and total mass concentration) for generated welding fume particles

FIG. 2. Size distributions of fresh (a) and aged (b) fume particles and continuous generation data (c) of fresh fume particles at 0.25 and 0.5 mA. TNC: Total number concentration; NMD: number median diameter; σg: geometric standard deviation.
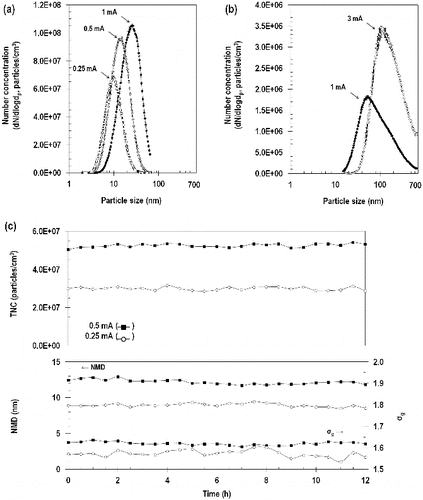
FIG. 2. Size distributions of fresh (a) and aged (b) fume particles and continuous generation data (c) of fresh fume particles at 0.25 and 0.5 mA. TNC: Total number concentration; NMD: number median diameter; σg: geometric standard deviation.

FIG. 3. TEM images of fresh (a) and aged (b) fume particles, projected area diameters (dPA) of fresh and aged fume particles (c) and primary single particles (d).
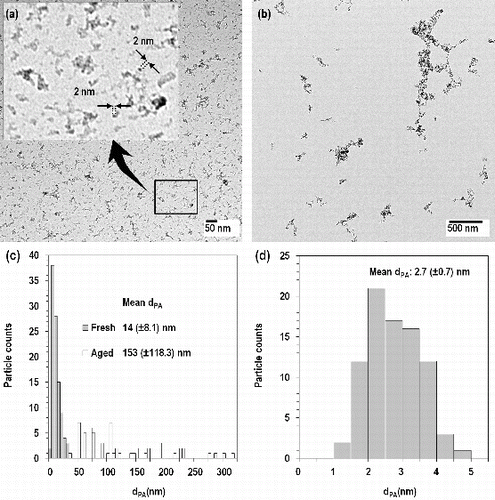
FIG. 3. TEM images of fresh (a) and aged (b) fume particles, projected area diameters (dPA) of fresh and aged fume particles (c) and primary single particles (d).

FIG. 4. EDX spectrum (a) and elemental maps (b) of aged fume particles. These maps are for Fe, O, Si, Cr and Ni. For EDX spectrum, the square region in the top left image of was analyzed. Particles were sampled on the Ni grid.
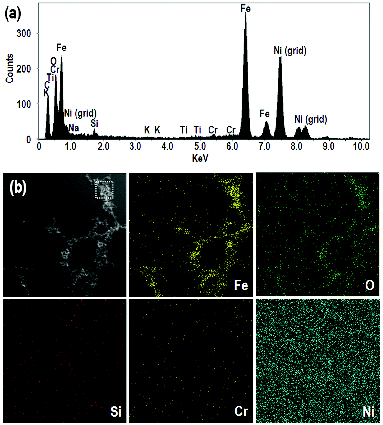
FIG. 4. EDX spectrum (a) and elemental maps (b) of aged fume particles. These maps are for Fe, O, Si, Cr and Ni. For EDX spectrum, the square region in the top left image of Figure 5b was analyzed. Particles were sampled on the Ni grid.

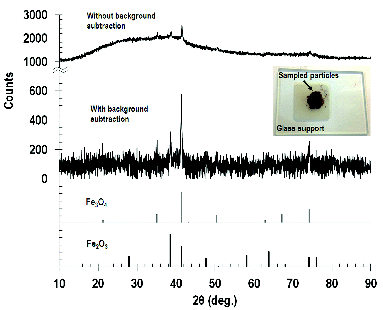
FIG. 5. XRD patterns of aged fume particles and reference powders; Fe3O4 and Fe2O3.

FIG. 5. XRD patterns of aged fume particles and reference powders; Fe3O4 and Fe2O3.

TABLE 3 O3 and NOX concentrations measured for spark discharge system (SDS) under different operating conditions

Reprints and Corporate Permissions

Please note: Selecting permissions does not provide access to the full text of the article, please see our help page How do I view content?

To request a reprint or corporate permissions for this article, please click on the relevant link below:

Academic Permissions

Please note: Selecting permissions does not provide access to the full text of the article, please see our help page How do I view content?

Obtain permissions instantly via Rightslink by clicking on the button below:

If you are unable to obtain permissions via Rightslink, please complete and submit this Permissions form. For more information, please visit our Permissions help page.