17,638
Views
46
CrossRef citations to date
0
Altmetric
Regular Articles

Assessing Optical Properties and Refractive Index of Combustion Aerosol Particles Through Combined Experimental and Modeling Studies

, , , , , & show all
Pages 340-350 | Received 09 Dec 2013, Accepted 23 Oct 2014, Published online: 11 Apr 2015

Figures & data

TABLE 1 Operating conditions of the CAST burner

FIG. 1. Schematic diagram of the experimental setup. TD is a thermal denuder.

FIG. 1. Schematic diagram of the experimental setup. TD is a thermal denuder.

TABLE 2 Real (mr) and imaginary (mi) parts of the refractive index of black and organic carbon components of combustion particles

FIG. 2. (a) Elemental carbon to total carbon ratio (error bars indicate one standard deviation), (b) brown carbon to black carbon ratio (error bars indicate one standard deviation), and (c) count median mobility diameter (error bars represent the 25th and the 27th percentiles) plotted as a function of C/O ratio. The dotted curve is taken from the data of Schnaiter et al. (Citation2006). The stoichiometric C/O ratio (C/O = 0.3) is also marked. The stoichiometric ratio separates burner conditions into fuel-lean and fuel-rich conditions.

FIG. 2. (a) Elemental carbon to total carbon ratio (error bars indicate one standard deviation), (b) brown carbon to black carbon ratio (error bars indicate one standard deviation), and (c) count median mobility diameter (error bars represent the 25th and the 27th percentiles) plotted as a function of C/O ratio. The dotted curve is taken from the data of Schnaiter et al. (Citation2006). The stoichiometric C/O ratio (C/O = 0.3) is also marked. The stoichiometric ratio separates burner conditions into fuel-lean and fuel-rich conditions.

FIG. 3. Mobility size distributions of particles generated from the CAST burner under different combustion conditions. The legend shows measured EC/TC ratios for these particles.

FIG. 3. Mobility size distributions of particles generated from the CAST burner under different combustion conditions. The legend shows measured EC/TC ratios for these particles.

FIG. 4. TEM pictures of combustion particles generated under (a) C/O ratio = 0.22 and (b) C/O ratio = 0.6.

FIG. 4. TEM pictures of combustion particles generated under (a) C/O ratio = 0.22 and (b) C/O ratio = 0.6.

FIG. 5. Contour plots of ∑dev(%) for the 467–530 nm interval in the plane of (a) real and (b) imaginary RI values with the other two RIs fixed to the values shown on each graph. Hollow circles indicate location of the data points.

FIG. 5. Contour plots of ∑dev(%) for the 467–530 nm interval in the plane of (a) real and (b) imaginary RI values with the other two RIs fixed to the values shown on each graph. Hollow circles indicate location of the data points.

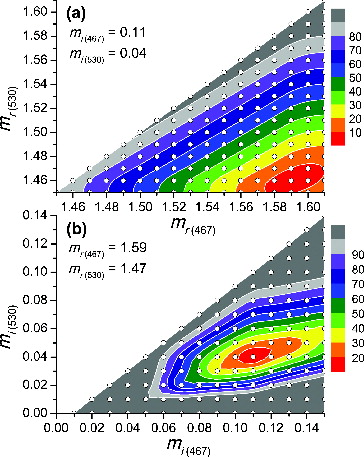
TABLE 3 Results of the sensitivity analysis for particles containing a high EC fraction

FIG. 6. Single scattering albedo (ω) vs. elemental carbon to total carbon ratio for λ = 530 nm. Filled squares: experimental data (with error bars of one standard deviation). Hollow triangles: Mie theory. Hollow circles: RDG theory.

FIG. 6. Single scattering albedo (ω) vs. elemental carbon to total carbon ratio for λ = 530 nm. Filled squares: experimental data (with error bars of one standard deviation). Hollow triangles: Mie theory. Hollow circles: RDG theory.

FIG. 7. (a) Absorption (αabs) and (b) scattering (αsca) Ångström exponents plotted as a function of elemental carbon to total carbon ratio for the 467–660 nm interval. Filled squares: experimental data (with error bars of one standard deviation). Hollow triangles: Mie theory. Hollow circles: RDG theory.

FIG. 7. (a) Absorption (αabs) and (b) scattering (αsca) Ångström exponents plotted as a function of elemental carbon to total carbon ratio for the 467–660 nm interval. Filled squares: experimental data (with error bars of one standard deviation). Hollow triangles: Mie theory. Hollow circles: RDG theory.

FIG. 8. Imaginary component of the refractive index (mi) for organic carbon as a function of wavelength. Filled circles: Kirchstetter (2004). Filled triangles: organic soluble matter, Adler et al. (Citation2010). Hollow triangles: water soluble matter, Adler (2010). Filled squares: Sato (2003). Filled stars: from this study. The solid line is a polynomial fit through the Kirchstetter data with the equation mi = 1.4304–6.49 × 10⁻³λ + 1.0126 × 10⁻⁵λ2–5.3939 × 10⁻⁹λ3.

FIG. 8. Imaginary component of the refractive index (mi) for organic carbon as a function of wavelength. Filled circles: Kirchstetter (2004). Filled triangles: organic soluble matter, Adler et al. (Citation2010). Hollow triangles: water soluble matter, Adler (2010). Filled squares: Sato (2003). Filled stars: from this study. The solid line is a polynomial fit through the Kirchstetter data with the equation mi = 1.4304–6.49 × 10⁻³λ + 1.0126 × 10⁻⁵λ2–5.3939 × 10⁻⁹λ3.
Supplemental material

UAST_1020996_Supplementary_Information.zip

Download Zip (399.3 KB)

Reprints and Corporate Permissions

Please note: Selecting permissions does not provide access to the full text of the article, please see our help page How do I view content?

To request a reprint or corporate permissions for this article, please click on the relevant link below:

Academic Permissions

Please note: Selecting permissions does not provide access to the full text of the article, please see our help page How do I view content?

Obtain permissions instantly via Rightslink by clicking on the button below:

If you are unable to obtain permissions via Rightslink, please complete and submit this Permissions form. For more information, please visit our Permissions help page.