Figures & data
Table 1. Specifications of instruments used in this study.
Table 2. Parameters of the fitted lognormal particle number size distributions (total number concentrations, modal diameter, and standard deviations) measured by the SMPSs (NanoScan, SMPS-L, and SMPS-N) and UCPC measuring compact and spherical particles (number 1–6 in Table S1 in the SI); all concentrations (PNtotal) in [cm−3] and all diameters (Dmode) in [nm].
Table 3. Parameters of the fitted lognormal particle number size distributions (total number concentrations, modal diameter, and standard deviations) measured by the SMPSs (NanoScan, SMPS-L and SMPS-N) and UCPC measuring agglomerated particles (number 7 to 12 in Table S1 in the SI); all concentrations (PNtotal) in [cm−3] and all diameters (Dmode) in [nm]. Values in bold: considered internal reference value for total PN concentration (UCPC) and for particle number size distributions (SMPS-N or SMPS-L).
Figure 1. Relative difference in PN concentration between the three SMPSs and UCPC measurement. Error bars indicate the standard deviation (±σ). The dashed (red) horizontal line indicates the considered arbitrary threshold of ±20% difference between PN measured (NanoScan, SMPSs) and PN expected (UCPC).
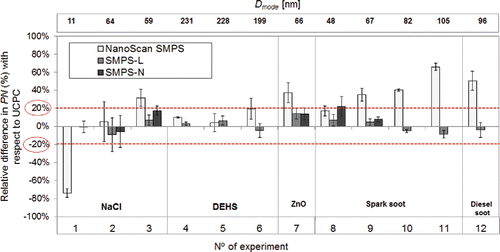
Figure 2. Relative difference in modal diameter between NanoScan and SMPS-L measurement (gray columns) and SMPS-N (black column). Error bars indicate the standard deviation (±σ). The dashed (red) horizontal line indicates the considered arbitrary threshold of ±20% difference between PN measured (NanoScan, SMPSs) and PN expected (UCPC).
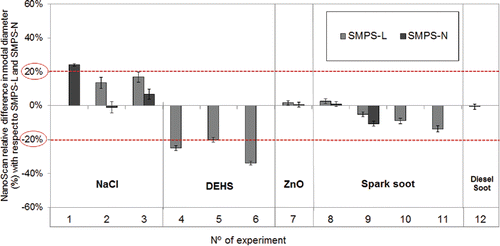
Figure 3. Measurement data and fitted particle number size distribution of generated particles measured in the exposure chamber with SMPS-N, SMPS-L and NanoScan: (a) 11 nm NaCl #1; (b) 60 nm NaCl #3 at high concentration and; (c) 199 nm DEHS #6. Error bars indicate the standard deviation. p = p-value.
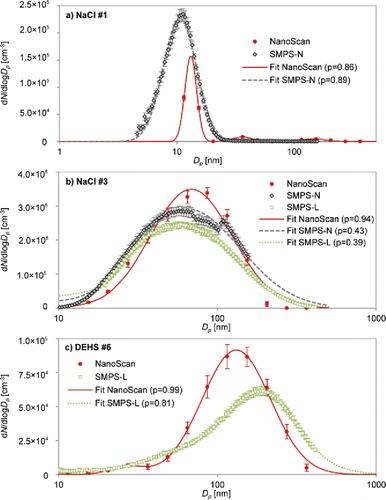
Figure 4. Measurement data and fitted particle number size distribution of generated 66 nm ZnO particles (#7), measured in the exposure chamber with SMPSs and NanoScan. Error bars indicate the standard deviation. p = p-value.
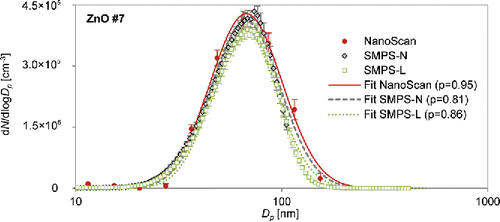
Figure 5. TEM images of collected samples: (a) 67 nm spark soot at high concentration (spark generated soot #9); (b) and (c) 105 nm spark generated soot at high concentration (spark generated soot #11).

Figure 6. (Left) Measurement data and fitted particle number size distribution of generated 96 nm diesel soot particles at high concentrations, measured in the exposure chamber with SMPS-L and NanoScan. Error bars indicate the standard deviation. p = p-value. (Right) TEM image of collected diesel soot particles.
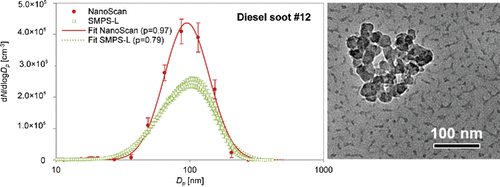
Table 4. Parameters of the fitted lognormal particle number size distributions (total number concentrations, modal diameter, and standard deviations) measured by the SMPSs (NanoScan, SMPS-L and SMPS-N) and UCPC measuring multimodal aerosols (number 13 to 15 in Table S1 in the SI); all concentrations (PNtotal) in [cm−3] and all diameters (Dmode) in [nm].
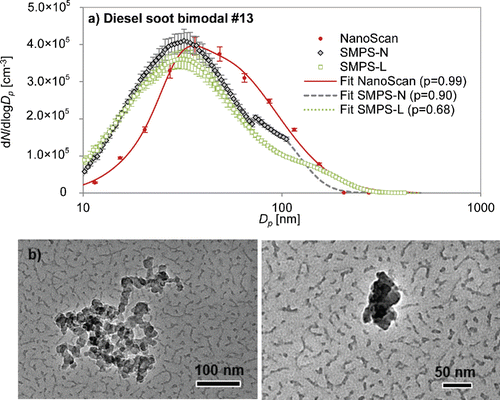
Figure 7. (a) Measurement data and fitted particle number size distribution of generated bimodal diesel soot, measured in the exposure chamber with SMPSs and NanoScan. Error bars indicate the standard deviation. p = p-value. (b) TEM images of collected 136 nm (left) and 31 nm (right) diesel soot particles.
