Figures & data
Figure 1. Picture of the exhaust stacks of the R/V Robert Gordon Sproul with the ambient sampling van secured to the aft deck.
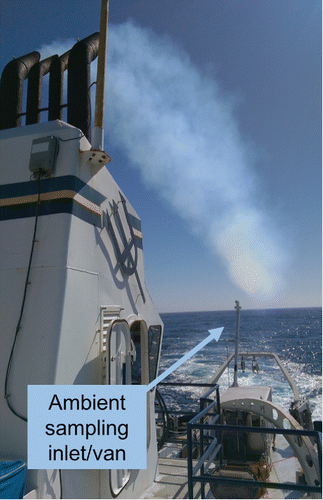
Figure 2. Background-subtracted HR-ToF-AMS organic mass spectra for fresh HDRD and ULSD emissions at 700 rpm engine speed (a–b), fresh HDRD and ULSD emissions at 1300 rpm engine speed (c–d), and aged HDRD and ULSD emissions (e–f). HR-ToF-AMS spectra from the 2015 cruise were used for the analysis.
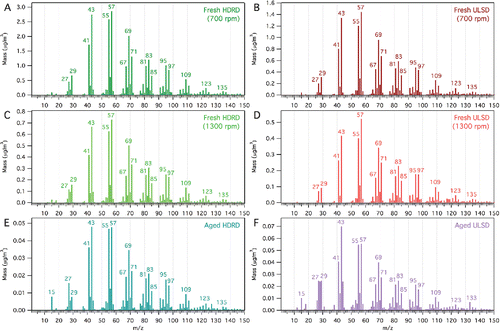
Table 1. Summary of the linear regression and dot product analyses for the comparison of the HR-ToF-AMS organic mass spectra.
Figure 3. Difference spectra of the background-subtracted HR-ToF-AMS mass spectra (normalized to total intensity) between HDRD and ULSD emissions (a–b), emissions at 700 and 1300 rpm engine speeds for both fuels (c–d), and fresh and aged emissions for both fuels (e–f). The shift of greater m/z 28 and 44 (CO and CO2 fragments) from 1300 rpm in HDRD to 700 rpm in ULSD is an artifact of background subtraction.
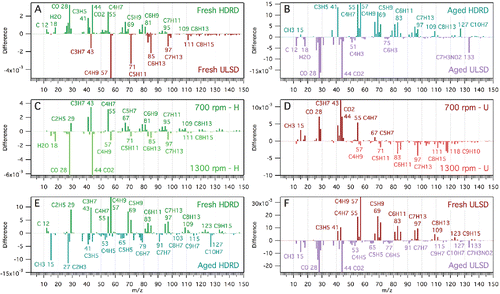
Figure 4. HR-ToF-AMS event trigger single-particle cluster mass spectra for the 2015 cruises. Four distinct particle classes were observed, including two hydrocarbon organic aerosol classes (a, b), a sulfate class (c), and an oxygenated organic aerosol class (d). The number of particles (NP) for each particle class are shown.
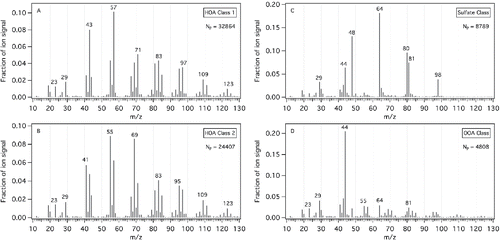
Figure 5. HR-ToF-AMS event trigger single-particle cluster analysis results for HDRD and ULSD emissions at 700, 1000, 1300, and 1600 rpm engine speeds as well as aged emissions, and marine background. The bars indicate the fraction of each identified particle class to the measured particle number. Four complete engine cycles (700–1600 rpm) were averaged for HDRD with whiskers showing the variability between cycles for each fraction. One complete engine cycle is shown for ULSD. The aged plume tests were divided into 1-h measurements (HDRD–4 h, ULSD–2 h). Marine ambient is the average of six separate 1-h marine background measurements. Individual measurement results are provided in Figure S4 in the SI. ET collection efficiency (CE) is likely particle-type-dependent. Therefore, the results are not CE-corrected.
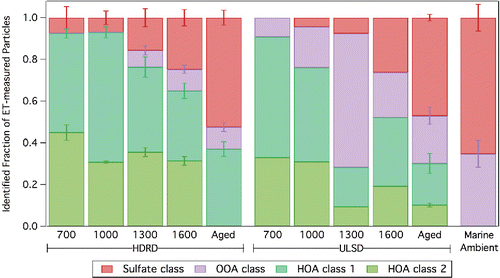
Figure 6. HR-ToF-AMS organic aerosol size distribution profiles for HDRD (9/30/14 and 9/26/15) and ULSD (10/1/14 and 9/5/15) emissions at different engine speeds. (Five-pass binomial smoothing was applied to the size distribution data.)
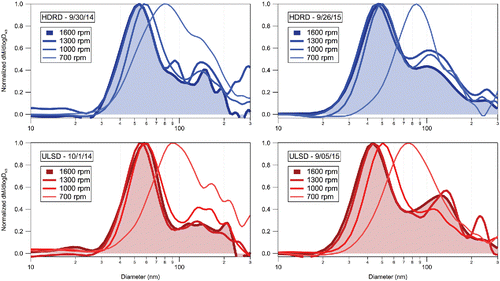
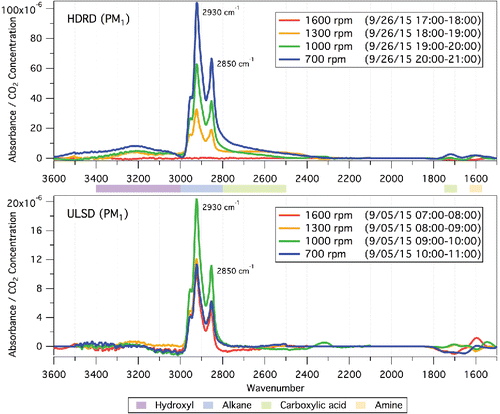
Figure 7. FTIR spectra (background subtracted and normalized to CO2 concentration) for PM1 size cutoff samples of HDRD (9/26/15) and ULSD (9/5/15) emissions at 700, 1000, 1300, and 1600 rpm engine speeds. Shaded areas denote absorption peak locations for different functional groups.