
Figures & data
Figure 1. Schematic and isometric view of the miniature inverted-flame burner showing its overall dimensions and main components. 1: fuel tube, 2: top cap, 3: co-flow air inlet, 4: porous discs, 5: co-flow air tube (quartz tube), and 6: exhaust outlet.
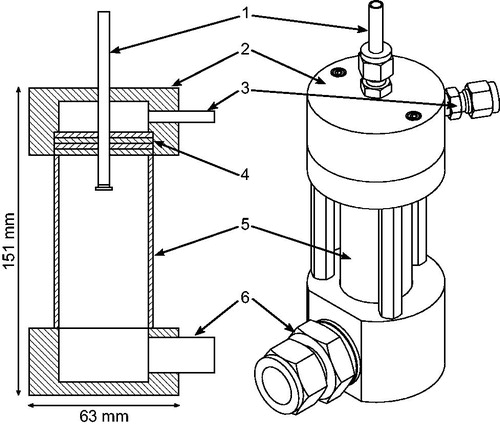
Table 1. Summary of three different geometries tested during the design of the burner.
Figure 2. Schematic of the experimental setup used to characterize the size, morphology, and carbon content of the particles.
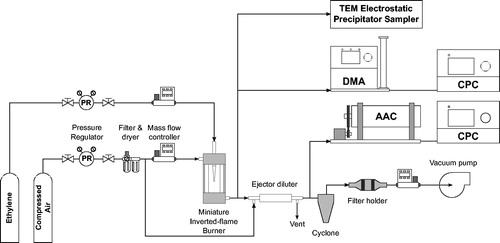
Figure 3. Overview of the tested ethylene and air flow rates. Dark gray and light gray colors indicate flow conditions where condensation of water vapor in the exhaust products is or is not expected, respectively. Letters indicate the shape of the flame checked visually for open (O), partially open (PO), and closed (C) tip. CB indicates curled flame base.
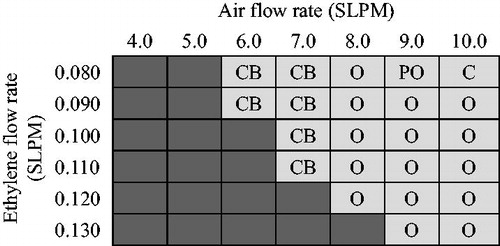
Figure 4. Image of flame shape with (a) closed tip, (b) partially open tip, (c) open tip, and (d) curled base.
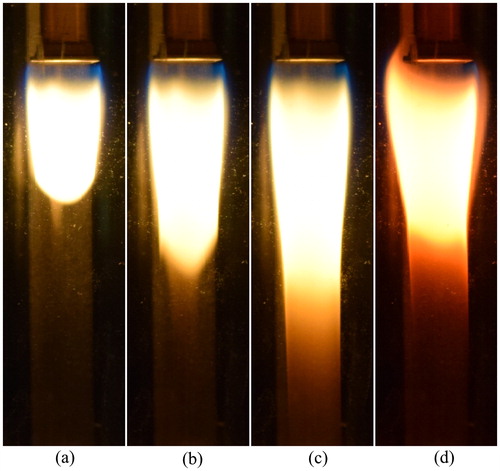
Figure 5. Repeatability of particle size distribution during steady state (after the initial warm-up time of the burner) for two representative cases: ethylene and air flow rates of 0.100 and 10.0 SLPM, respectively, and ethylene and air flow rates of 0.080 and 9.0 SLPM, respectively. In each case, the solid line is the average mobility diameter size distribution and the shaded band is the standard deviation.
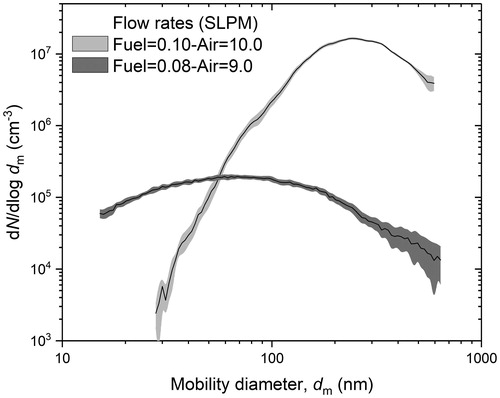
Figure 6. Burner flow conditions for open or partially open tip flames with corresponding (a) global equivalence ratio, (b) total particle concentration of lognormal fit, (c) mode diameter of lognormal fit, and (d) geometric standard deviation of lognormal fit.
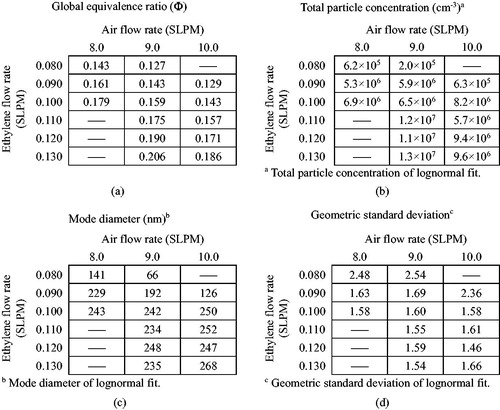
Table 2. Four representative flow conditions with corresponding global equivalence ratio and mobility diameter size distribution parameters.
Figure 7. Total concentration and mode of mobility diameter of particles for fuel flow rates from 0.08 to 0.130 SLPM and a constant air flow rate of 9.0 SLPM.
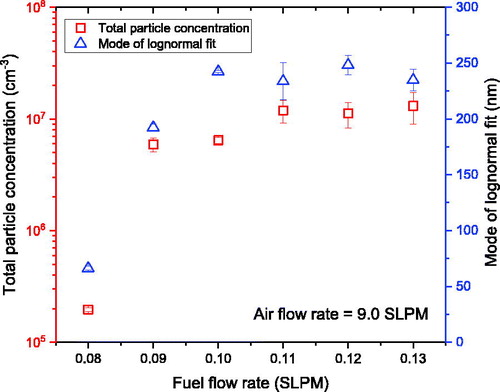
Figure 8. Mobility size distribution for four representative flow conditions.
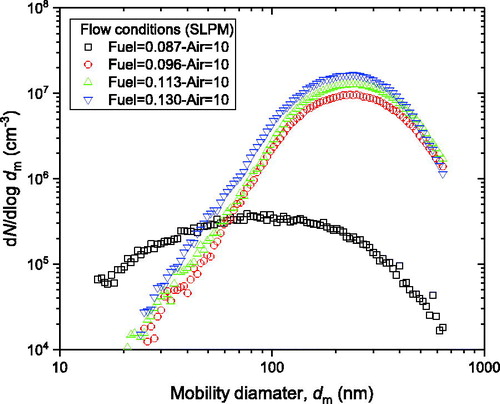
Figure 9. Sample TEM images of soot particles showing typical soot aggregates in (a) and (b), graphitic layer structure of primary particles in (c), and clustered superaggregates in (d)–(f).
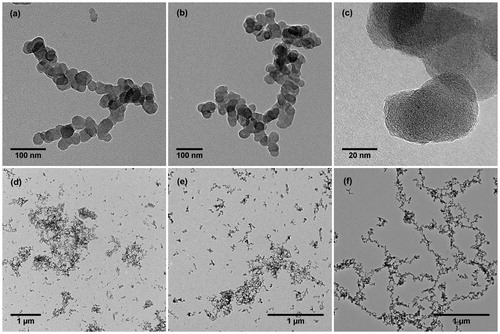
Figure 10. Aerodynamic diameter size distribution for four representative flow conditions.
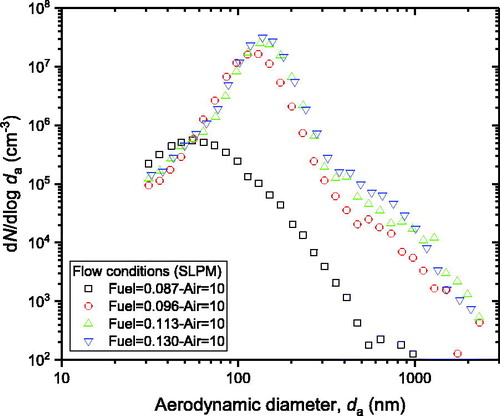
Table 3. Concentration of OC on the first and second filters, particle-phase OC, EC, and EC/TC ratio for the four representative burner conditions.