Figures & data
Figure 1. Diagram of the fast flow dilution system used in the waterpipe smoking experiments. A fraction of the total puff flow is sampled through the dilution system (F2, ∼3 L min−1) while the rest is pumped off (F1, ∼10 L min−1). Dilution air from a purge air generator is provided in the two stages of dilution and the flows in and out are balanced (F4 = F4′ and F5 = F5′). Flows F2 and F3 are equal and governed by the sum of the analytical instruments connected at the end of the mixing section as F2 = F3 = Ftotal = FTDCIMS + FSMPS + FPTR-ToF-MS + FCO.
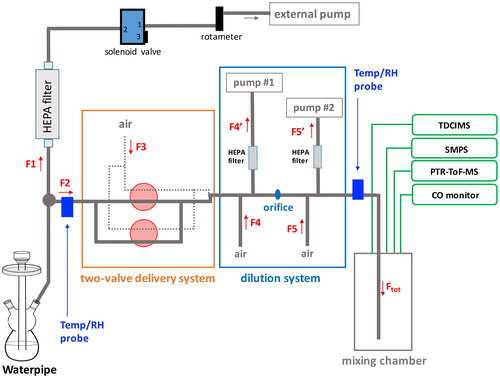
Figure 2. Typical unit mass resolution PTR-ToF-MS mass spectra from (a) the waterpipe mainstream smoke of the conventional tobacco and (b) the 3R4F reference cigarette. All spectra were collected at the end of the smoking session (the last 10 puffs for the waterpipe sample, and the last puff for the cigarette sample) and the background signal has been subtracted out.
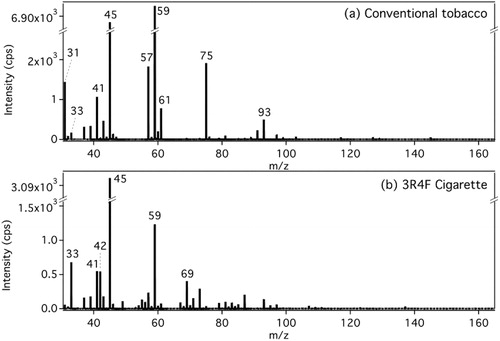
Table 1. Ions observed in the PTR-ToF-MS mass spectra from the waterpipe mainstream smoke samples (conventional tobacco; nicotine-free herbal tobacco; dark leaf unwashed tobacco) and the 3R4F reference cigarette.
Figure 3. Typical size distributions for individual smoking sessions measured for (a) the conventional tobacco and (b) the 3R4F reference cigarette. Concentrations are corrected for dilution and size-dependent sampling losses through the experimental system. The start of the smoking session corresponds to the sudden increase on the particle number concentration.
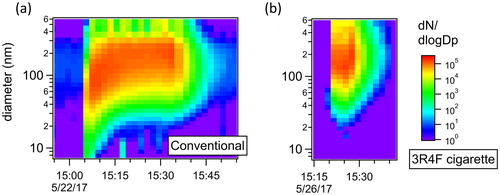
Figure 4. Concentration profile of nanoparticles with diameters d < 20 nm (a), d < 50 nm (b), d < 70 nm (c) and d < 100 nm (d) measured in the mainstream smoke as a function of smoking time for the conventional tobacco (black trace; n = 4), the coal only experiment (pink trace; n = 3), the conventional tobacco with no water (red trace; n = 2) and the 3R4F reference cigarette (blue cigarette; n = 3). Concentrations are corrected for dilution and for size-dependent transmission losses through the experimental system. Error bars are one standard deviation of the mean.
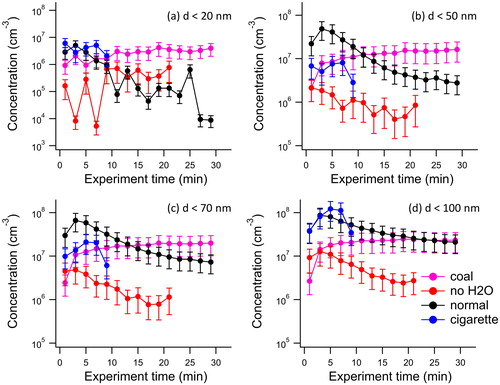
Table 2. Averaged dose of particles inhaled by a smoker determined from size distribution measurements as a function of particle diameters defined as the total number concentration of particles contained in 1 puff (hookah puff volume = 860 mL; cigarette puff volume = 36 mL).
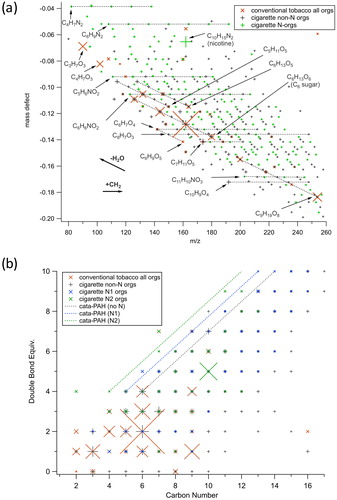
Figure 5. (a) Kendrick mass defect plot based on CH2 units from TDCIMS measurements and (b) Double bond equivalent plot for TDCIMS-detected ions for respectively two characteristic experiments one with the conventional tobacco using the waterpipe, and one experiment using the 3R4F reference cigarette. In (a), formulas are given in their detected ionic form (as an H+ adduct) with the charge symbol dropped to avoid clutter. The orange X markers are data from the tobacco, which had almost no major contributions from N-containing molecules. The + markers are from the cigarette experiment, where gray points are non-N organics and green points are N-containing organics. The symbol sizes are scaled to the relative intensity of the peaks in the mass spectra, and only peaks contributing at least 0.1% to the total signal were included. Vectors indicating shifts of CH2 addition and loss of H2O are indicated with labeled bold arrows. In (b), the lines correspond to the region where cata-condensed (i.e., least compact) PAHs with 0, 1 or 2 heterocyclic nitrogen respectively would appear. Thus, if a molecule falls in the line or is above the line, then it is most likely a condensed-aromatic.