Figures & data
Figure 1. Locations of the measurement stations within the HMA.
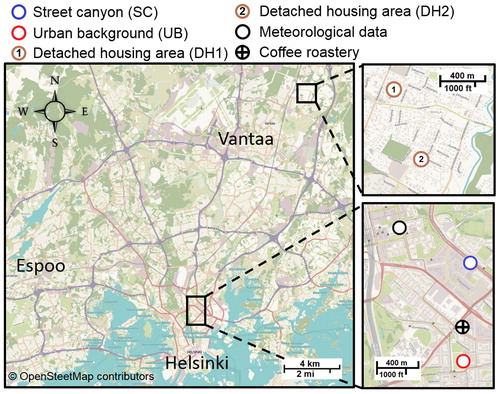
Table 1. Statistics of LDSA concentration levels (units in µm2 cm−3).
Figure 2. Scatterplot of LDSA measured with the Pegasor and DMPS. The color of the data points indicates the time of the measurement.
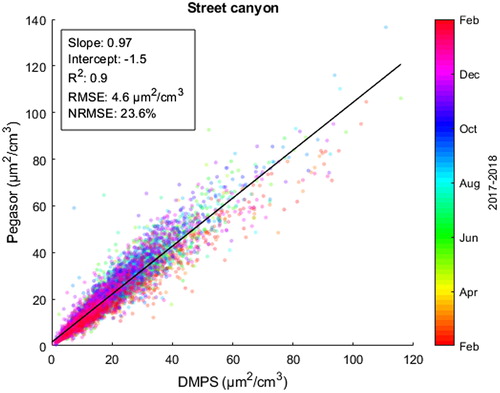
Figure 3. Monthly slopes and intercepts of the DMPS and Pegasor linear regression.
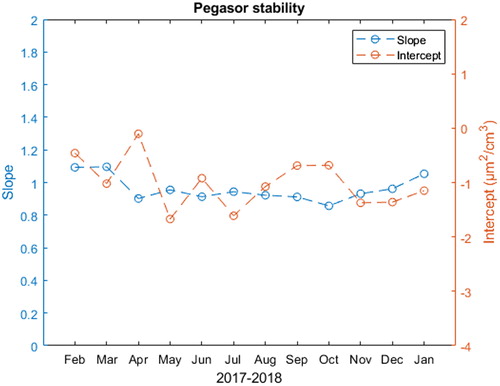
Table 2. LDSA (alveolar region) concentration levels recorded in different studies (units in µm2 cm−3).
Table 3. Statistics of LDSA relations to other parameters (units in µm2 cm−3).
Figure 4. Diurnal cycles at different sites during winter (a) and summer (b). Solid continuous lines represent mean values, boxes 25th and 75th percentiles and the line inside the quantile boxes median values. Both weekday and weekend data are included.
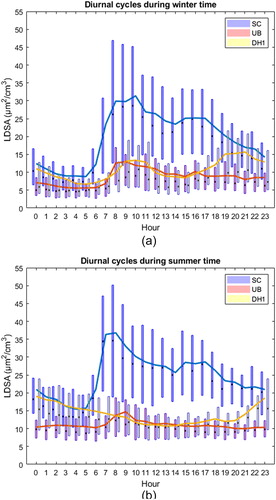
Figure 5. Seasonality of LDSA at different measurement sites.
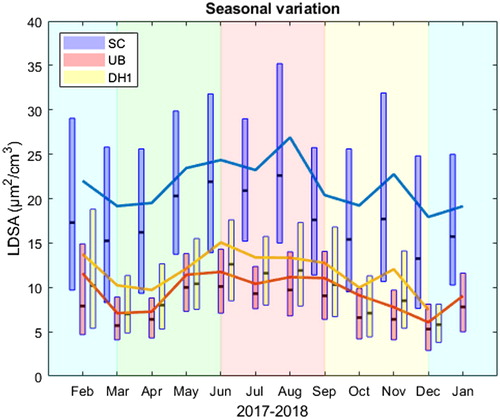
Figure 6. LDSA concentrations as a function of LDSA to BC ratio (colorbar) and as a function of wind direction (x-axis).
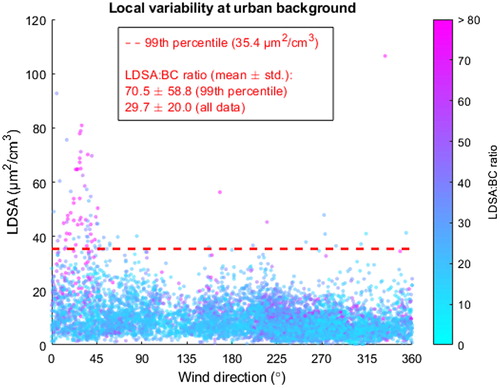
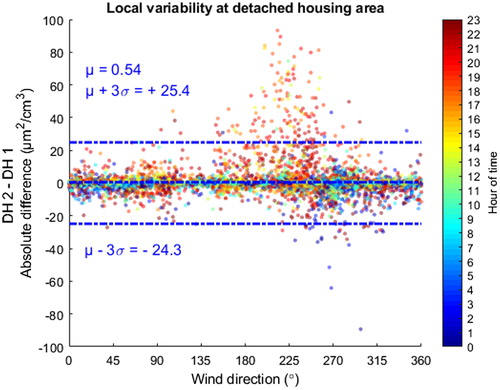
Figure 7. Differences of measured LDSA values at DH1 and DH2 stations as a function of wind direction and hour of day. The dashed middle line represents mean and the two dashed-dotted line standard deviations multiplied by 3.